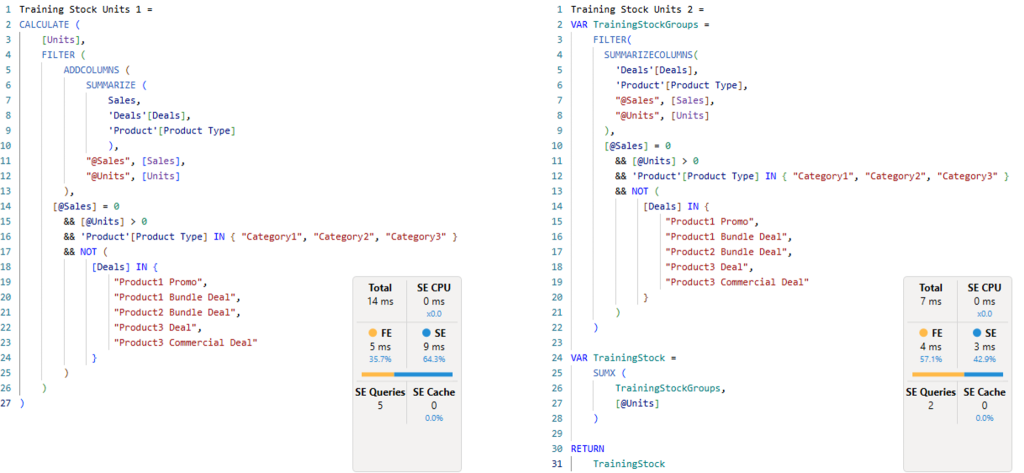
How Many Employees by Period
I have many reasons for sharing content online. The main reasons are that I like sharing what I know, but also that I want to document how to complete a task for future reference. My article today ticks both of those boxes. How Many Employees by Period I’m calling this

Field Parameters in Power BI
The May 2022 version of Power BI Desktop includes a very interesting and useful feature – Field Parameters. Today I will show you how to use this new feature illustrating with 3 (no, wait, 4) use cases – Chart Elements, Chart Axis, Table Contents and Permanent Ad hoc Hierarchies. How

Gartner Magic Quadrant for Business Intelligence – 2022 Update
Updated May 2022 I update this blog article regularly to keep track of how Microsoft is progressing on its strategic journey in building a world class BI platform. Gartner released the 2022 magic quadrant for Business Intelligence in March 2022. As expected (by me at least), Microsoft is continuing its

Exploding Measures using Tabular Editor 3
What?! Exploding Measures I hear you say. Exploding, expanding, use which ever word you like; what I mean is when you want to remove any refence to a measure INSIDE another measure. Example Consider the 3 measures below. Total Sales = SUM(Sales[ExtendedAmount]) Total All Product Sales = CALCULATE([Total Sales],ALL(Products)) %

Poor Man’s Paginated Reports in Power BI
Paginated Reports have been available in Power BI since 2019. They serve an important purpose, but they are not easy for the average business user to learn, plus they require Power BI Premium to use. In my blog and video today, I will show you how you can use Excel

Dataflows 101
Matt here. I want to do a brief introduction prior to handing over to Roland. I have known Roland for a couple of years now – he is a member of the Sydney Power BI User Group. What I didn’t know until very recently is that he has the same

Real Life Power BI Demo – What Size Water Tank Do I Need?
I always tell people in my training classes that the best way to become good at using Power BI is to get plenty of practice. Best case scenario, you would do something at work that will help you succeed in your job and hence you will get paid to learn.

Deep Dive into InfoRiver Export to Excel
This is a further article in my series where I share with you what I have learnt about the InfoRiver custom visual. As good as Power BI is, it will take Microsoft many more years to make it fully featured. Microsoft Excel is 37 years old, and I can assure

Plotting 2 Columns on the Legend of a Chart
At a recent training course, one of the students asked if it was possible to add two different columns on the legend of a line chart, so that when a selection is made on a second slicer the chart splits to reveal multiple lines. Given others in the class showed

Using Macros in Tabular Editor 3
I have written quite a few articles about Tabular Editor over the last few years. I recently started using Tabular Editor 3, and I absolutely love it. Buying this product is one of the easiest ways you can significantly improve your Power BI Data Modelling productivity. For US$100 per year

Do I Need a Power BI Premium Per User Licence?
As is often the case, the inspiration for many of my blog articles comes from my experiences working with clients. Today I was on a call with a client in the USA who is still very early into his PowerBI.com journey. I noticed that he had a Power BI Premium

Two Number Formats, One Column – WHAT!
Back in 2016, I created this idea at ideas.powerbi.com. I wanted to be able to have 2 different number formats in the same column in Power BI. This is particularly useful for things like a P&L report, but it is also useful for other types of reports. Doing this in

New Export to Excel Format in Power BI
I have been waiting for this feature to be delivered for a while. Until this week, the only way to export data from Power BI was to do it into a source data table. That meant that if you had data laid out like shown below, and you exported it

Build a Power BI P&L in 5 Mins with InfoRiver
I mentioned in an earlier blog that I have been doing some work with the owner of the InfoRiver Power BI Custom visual. I have been testing, given UI feedback, and more recently I have produced some instructional videos. I wanted to share the first of these videos with you

5 New Features I Love – Coming Soon to Power BI 2021
You may already be aware (but then again, maybe not) that Microsoft shares its plans for upcoming new features for the Power Platform every 6 months, and Power BI forms a subset of that plan. The next plan is called Power Platform Release Plan 2021 Wave 2. It takes a

Dynamic Commentary in Power BI
Today is another in my series where I am building out my COVID report for Australia. There are a few things I cover in the video today. The main “new” concept is the dynamic commentary, but I also show you some more warts and all insider view of building a

What does the Data Say?
I have a very simple video today with not a lot of DAX needed; I just want to demonstrate how you can gain insights from data. On 10th Sept 2021, NSW health made a material change to the Active Cases reported for COVID-19 in Australia (as you can see in

When to use Power Query/M vs Data Modelling/DAX
Ken Puls and I decided we would do a live stream chat to talk about a topic of interest to Power BI people. We put out a survey and 75% of the respondents wanted to hear about “when to use Power Query/M vs Data Modelling/DAX”. It’s a really interesting topic

Variables in DAX
Earlier this week I did a live stream event. I put out a poll and asked people to tell me what topic they wanted me to talk about. The options were Calculated Columns vs Measures Tips for Excel users moving to Power BI Using Variables in your DAX The overwhelming

Overlaying Trends from Different Dates
In my video today, I continue to build out my Power BI Covid Australia report. I wanted to overlay 2 phases of time on a single chart, as shown below. There were a few things I needed to do to make this work, including writing some time intelligence to get