I blogged about how to Build a P&L With Power BI back in April 2020, and the response from my readers was great. Several people asked how to add percentages such as % of net sales revenue, % gross profit, etc. into the P&L. I decided therefore to do a follow up article to show how you could add percentages to the P&L and also to further demonstrate how I go about solving such problems. Keep in mind, there is rarely one way to solve a problem in DAX; I’m simply sharing the way I solved this problem.
One Solution to Add a Percentage to a P&L
I have recorded a video that steps through the process. The link to the video is at the bottom of the page. In summary, these are the steps I followed.
- I started off with the measure Total Amount as I defined in my previous article.

- I adjusted my Header table from my previous article (#1 below) and added the headers for % values (#2 below). Note that I have also added some new CalcTypes (3 & 4).
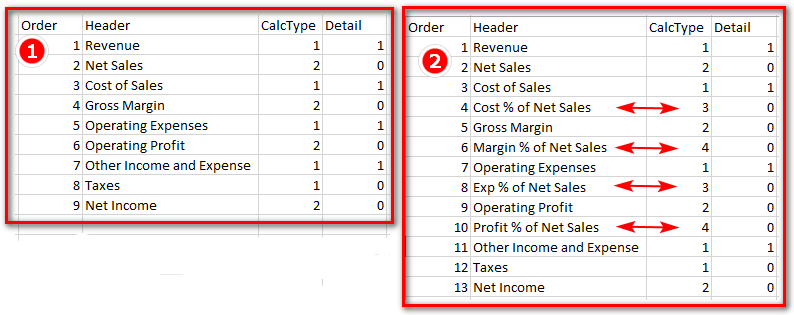
-
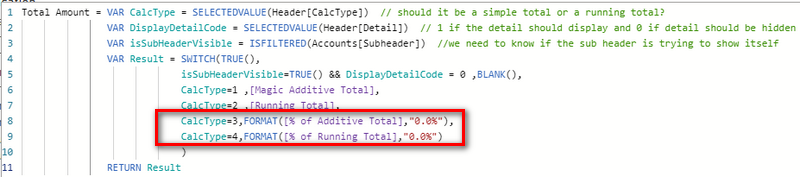
Next I wrote formulas for % of Additive Total and % of Running Total as shown below.


- Finally I updated the Total Amount measure to display the % where I wanted them to appear, as shown below.
The Video
I recorded a video showing my step by step process of solving the problem.
There is now a third post in this series that you can read here https://exceleratorbi.com.au/build-a-pl-in-power-bi-without-any-dax/
Hi Matt
How do I add a %of Sales as a column in the incomestatement?
I have sub categories but they don’t calculate the % following your tips above.
I am happy to share my file with you.
Thanks
Carlo
Hi Carlo,
If you are trying to add an extra column to your matrix, then you have an Asymmetrical Columns challenge.
Check out the article for guidance, or if you need more direct assistance, you can purchase an hour of consulting, and we’d be happy to assist.
Hi Matt,
This is absolutely brilliant and helped me a lot. can you kindly let me know how to add some other different ratios using already existing and non-existing fields in the ledger table? As an example, I need a ratio calculation between a subheader account and a different measure which not available in charted accounts.
Thanks,
CN
These are not simple questions :-). The short answer is you need to be able to write the measure so it gives the correct answer, then insert it into the flow of your P&L so that it displays in the correct location. I have demonstrated both concepts in the demo. I can provide commercial support to help you out if needed, or if you need free help, then I suggest you ask at community.powerbi.com
HTH
Matt, thank you very much for this brilliant P&L! It is amazing! You really help me build up my DAX skills. I have a specific problem in the P&L am building for my company. I will try to explain it using the same column names as in your example. In my “Subheader” column from the Accounts table I have a row called “Production depreciation” with is included in the “Cost of Sales” from the Header. Down in my P&L where I calculate the “Operating Profit” I have to exclude this line in order to have the most correct Operating Profit as per my company understanding. Here is what I am trying to do but it is not working: I am adding a new line in my Header table called “EBITDA” with CalcType 3, then my measure for calculating this EBITDA is as follows but it does not work:
CALCULATE(
SUM(‘PL Data'[ACT])
FILTER(Accounts, NOT Accounts[Subheade] IN {“Production depreciation”, “Commercial depreciation”, “Admin depreciation”, “Interests”} )
)
Thanks!
These things are tricky. If I were solving it, I would first write a dax formula that gave me a standalone, correct answer. Then I would work out how to add it to the switch measure so it displays at the right time. No doubt there are good and not so good ways of doing it, but it depends on the detail. If you would like my commercial support to solve it for you, you can purchase some time from my shop at http://xbi.com.au/matt
Matt, your blogs on building a P&L in Power BI are brilliant! It’s complicated DAX but you present it in such a way that it’s easy to follow and understand the logic as you build on each step. Thank you for sharing you this!
I have a question for you on a different percentage calculation. How would you build a new column in your P&L – a “% of Total Sales”? This column would take the sum of total Revenue from the Revenue row and calculate the percentage of revenue for each row below that. This calculation would need to work on both the header level and when you drill down to the subheader levels. I haven’t gotten this to work yet. Wonder if you have some insights (or would this make for an interesting “part 4” in your series)? Thanks!
I thought I had done this already, somewhere. Days blur into nights, into months and years – sometimes I forget :-). My objective is always to share the process rather than the solution. The short answer is “I don’t know the formula, but you need to follow the process”.
1. write a WIP measure that returns the Total Sales regardless of what is in the P&L visual. If you can’t get that to work, you can’t get the % to work.
2. divide the P&L row level by the total above.
3. if you want to be selective when to show and hide the % result, work out a true/false switch to show or hide the result
Hello good day!
First of all, thank you for the P&L video. It is being very useful in the construction of my reports, but I have a problem when comparing the current year against the previous one.
I’m new to Power Bi and I’m learning about DAX measurements.
Can you help me?
It’s a huge topic and beyond the scope of these blogs. I suggest you ask for assistance on one of the forums, such as community.powerbi.com
If you are after commercial support, I you can engage me to help you by purchasing some time from my shop at http://xbi.com.au/matt It should be solvable with 1 hour max.
Hey Matt:
It would be helpful if you provided links to subsequent articles, like this one just published:
https://exceleratorbi.com.au/build-a-pl-in-power-bi-without-any-dax/
Good point Ron. I do try to do this, but I don’t always remember. Thanks for the reminder.
This is a very methodical presentation. Thanks so much, I undertake to learn PBI, looks like it does have a lot of interesting ways to solve challenges.
Thanks again!
Hi Matt,
first, thanks for the P&L video last year. This has helped me a lot. The problem described here I have also solved in almost the same way. Unfortunately, this brings up a new problem. Since the FORMAT function returns a string, difference measures (for example Total Amount A ./. Total Amount B) no longer work. If you do the subtraction before the final measure (the one with the CalcTypes) you get wrong percentages (because they now only refer to the already subtracted amounts). Another approach was a difference measure with the SUBSTITUTE function, where the % sign is removed and thus a number is returned again instead of a string. This works, but the final measure can no longer be filtered. Do you have any other ideas? I’ve been racking my brains over this for months. In any case, thanks again for the great tutorials!
Thanks
Can you not create a custom format to the measure on the relationship page to maintain it as a value?
Since the created measure contains both strings and numbers, the data type variant is returned. As far as I know, this cannot be overridden.
This measure is for display purposes. If it causes downstream issues for other calculations, simply create a duplicate measure and remove any formatting, then use that inside your downstream measures
Thank a lot Mr.Matt for such a great videos and explanation on both P & L parts.