Level: Beginners
I blogged on conditional formatting in Power BI Table visual here when it was released in the May 2016 Power BI Desktop update. At the time of first release, the conditional formatting was pretty basic with only 1 formatting option available. Over time, Microsoft has improved this feature, and now, it is available in both Table and Matrix visuals in Power BI with multiple formatting types and accessible from both the fields and format views. Let me provide you a summary of what conditional formatting can now do for you below.
Why You Need This
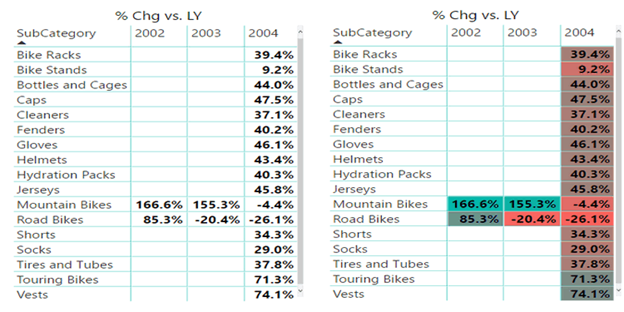
Conditional formatting is one of the easiest ways to turn tables of boring data into a visual that almost makes the numbers jump out at you on a page. There is nothing worse than looking at pages and pages of numbers and then trying to find insights from those numbers. Conditional formatting helps you format your tables (and matrixes) of data so that the patterns and outliers in the data are easier to spot at a glance. Take a look at the before and after images below and see how much easier it is to see the variations in performance.
Conditional Formatting from the Fields View
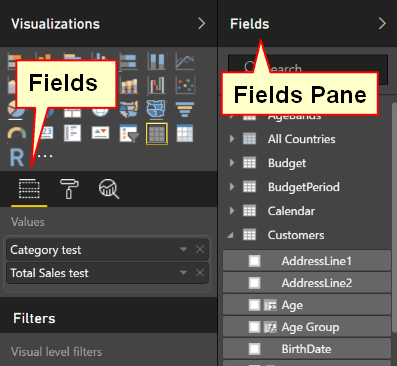
The fields view (or is it card?) appears on the right hand side of the reporting canvas in Power BI Desktop and also PowerBI.com as shown below. Don’t confuse the Fields view/card with the Fields pane.
To add conditional formatting, you first should make sure you have a measure in the values section of your visual (the table or matrix visual). Then you can either right click on one of these measures in the values section of the fields view, or click on the arrow next to it (shown as 1 below), then select Conditional Formatting (2 below) and choose the type of conditional formatting from the available options (shown as 3 below).
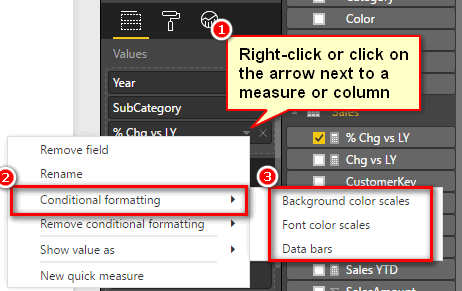
The 3 different conditional formatting types available at the time of this article are:
- Background color scales.
- Font color scales.
- Data bars.
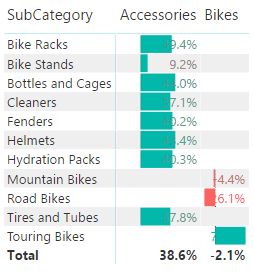
The 3 different formatting options are demonstrated in the image below. This is a table, but it is similar in a matrix.

Each of these options has a different dialog box of options for you to select to achieve the look and feel you are after.
For formatting with Background color scales, you have the following options:

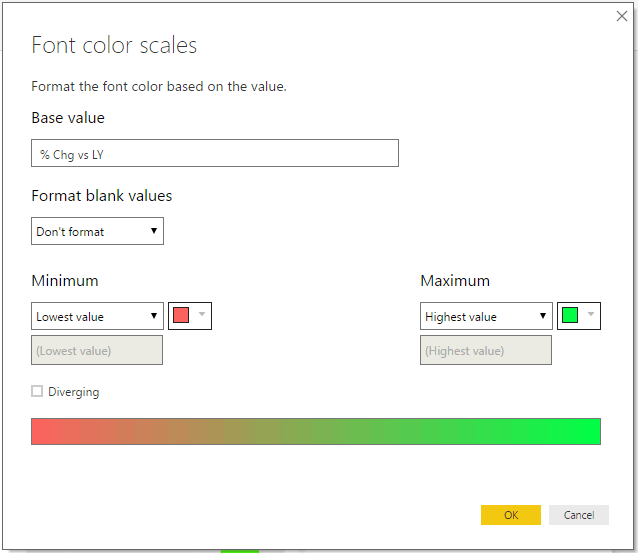
For formatting with Font color scales, you have the following options:
For formatting with Data bars, you have the following options:

Most of the options are pretty self explanatory.Note at this time it appears you can’t apply the format to the total row (you have this optional setting for a pivot table in Excel, but not here – yet).

Combining Conditional Formats
You can have a combination of these conditional formatting options applied on the same visual. For e.g. With Data bars and Font color scales, it looks like this.
Removing Conditional Formatting
Once you have applied conditional formatting, you may decided you don’t like the way it looks. You can remove the conditional formatting applied to your table or matrix visual with either a right-click on the measure or column in the values section of the fields view, or with a click on the arrow next to it (shown as 1 below). From there you can selectively remove a type of formatting or remove all the formatting applied on the visual (options shown as 2, 3 and 4 below).

Conditional formatting from the Format view
In the Format view, you can find the Conditional formatting option when you scroll down within the Format View (paint roller icon) as shown below.

When you click on the arrow to expand the conditional formatting card (shown as 1) you will find the list of values in the selected visual (shown as 2) and the 3 conditional formatting options (shown as 3).

To apply any of these formatting options, you can turn the option on using the slider (shown for example as 1 and 3 below). Once you have done this, then an Advanced controls link will appear as shown in 2 and 4 below.

If you then click on the Advanced controls link, the formatting options dialog box appears just as shown earlier in this article.
A Final Word
Now you know conditional formatting is there, and how to use it, there is no excuse not to make your reports come alive so that you and your readers can get the most from your efforts.
Hello
Can I use conditional formatting in a Card?
thank you
No, but there is a KPI card and a number of custom visuals that have colour capabilites
Not yet, but I am sure it will come
Well explained with example. Worth trying and would be interested to know if we can make the conditional formatting dynamic using formulas like MS Excel.
real time question asked by Rupesh.. I am looking another solution in power BI.
Can we perform color on cell (not image URL) based on condition. for example
we have two columns one is “Status” and other one is “SalesAmount and I want to fill status column with specific color based on some condition like “SalesAmaount >500 then RED else Yellow.
Your help would be highly appreciated if I get solution.
They updated conditional formatting using rules last month. I am pretty sure you can do this now. Just take a look