Level: Beginners
First posted May 2015, Updated Feb 2021. Many aspects of this article also apply to Power Pivot for Excel.
Technically you don’t need calendar tables to use Power BI. Power BI comes with an inbuilt date capability called “Auto Time Intelligence”. But the inbuilt capability is very basic, and worse still, it has some negative side effects. In this article I cover what comes out of the box and the preferred approach of building your own power BI calendar table.
Auto Time Intelligence
Auto time intelligence is the way Microsoft makes it easy to “roll-up” dates into the concepts of Months, Quarters, and Years. This feature is on by default. You can find (and change) the setting by opening Power BI Desktop and navigating to File\Options and Settings\Options as shown below. In the section Global\Data Load (shown below) you can turn this feature on/off permanently.
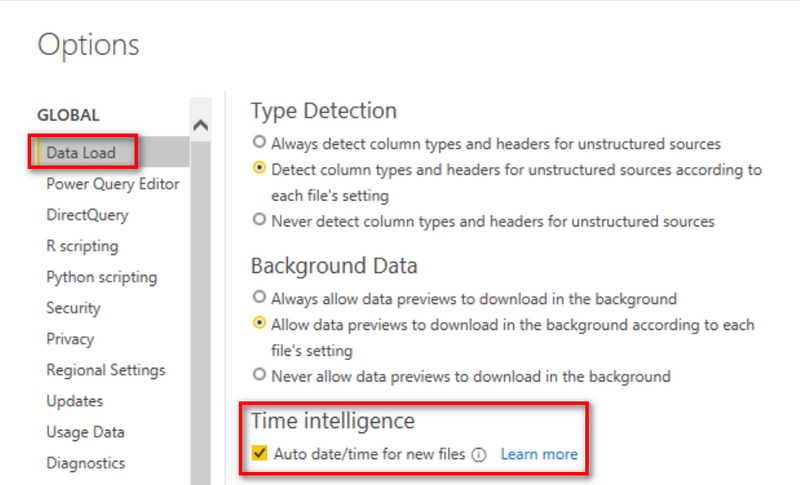
You can also navigate to Current File \Data Load and turn it on/off just for the active workbook (as shown below).

Auto time intelligence is very basic in its capabilities and it has a number of issues.
- It only works on calendar years (no fiscal years – unless you are fortunate that your fiscal year is the calendar year).
- It is always at the day level of granularity.
- It only rolls up from days to months, quarters and years. There is no handling of weeks, or trimesters, or ISO (445) calendars, or any other business specific time periods that may be needed.
- It creates 1 hidden calendar table for every date column in your report. This fact can make the size of your workbook grow much larger than it would otherwise.
- Each calendar table is independent; there is no way to model a single slicer to filter multiple date columns (although this can be done in the UI by grouping slicers).
This auto time intelligence is really aimed at absolute beginners who do not want to learn how to model their own data. My view is that you should turn this feature off and instead build your own calendar table.
Reasons to use a Calendar Table in Power BI
There are many good reasons to create your own calendar table in Power BI. Building your own calendar table allows you to:
- Use the filtering power of Power BI to make your reports fast and snappy by accessing relevant columns of data that form part of the calendar table.
- Filter your reports on attributes such as Year, Month, Quarter across as many data tables as you need (eg Actual Sales, Budget Sales, Stock on Hand) as well as any other aggregation of time you need for your business.
- Create your own custom view of time that may be different to a standard calendar (such as a 4/4/5 calendar) and/or create your own definition of what is a financial year.
- Create calendar tables for time periods that are not at the “day” level, eg Month, Year, Minute, etc.
- Build concepts like a time intelligence calendar table. These can be used to allow a user to select a time horizon from a slicer (e.g. Today, Yesterday, This Week, Last Year) and have the report automatically update to reflect that time period.
In some situations you simply must have a calendar table:
- If you want to use some of the more advanced inbuilt time intelligence functions in DAX (like rolling 13 week sales).
- Load and report on data that is not at the day level of granularity.
If you load a “standard” calendar table in Power BI (rules below), you can use the inbuilt time intelligence functions. There are other ways to create time intelligence formulas other than the inbuilt functions, but generally the DAX is a bit more complex. More on that later.

Rules for a Standard Power BI Calendar Table
Here are the rules to build a conforming standard calendar table. You must follow these rules if you want to use time intelligence functions. You don’t have to follow these rules if you don’t need/want to use the inbuilt time intelligence functions (but it is still good practice particularly if your data is at a “day level” of granularity).
- You must have a date column in your calendar table
- The dates in this column must be in a contiguous range that covers the entire period of your data from the first day of the first year of your data to the last day of the last year of your data:
- No missing dates. It doesn’t matter if you don’t work weekends, you MUST include ALL dates in the calendar table including weekends.
- No duplicate dates
- The calendar table can be marked as “date table” (specifying the date column when prompted).

- You must use this step if the calendar table is joined to a data table using a surrogate key (eg if your join is on a text column like DDMMYYYY, which technically is text, not a date).
- You must use this step if you want to use quick measures to help you write time intelligence functions using your own calendar table.
- Apart from the 2 scenarios above, this step is not mandatory for the calendar table to work.
Additional Features of a Good Calendar Table
In addition to the above mandatory features (for inbuilt time intelligence to work), there are some things that you should do to get the most out of any calendar table you build.
- Include columns for every time attribute you want to use in your reporting. eg Year, Month, Week, Day Name of Week etc.
- Include an integer ID column that starts at 1 and increments by 1 for every relevant column in the calendar. E.g. create a MonthID column that starts at 1 and increments by 1 for every month without resetting at the end of each year (1,2,3,…12,13,14 etc). This is very useful for writing custom DAX time intelligence formulas.
- Include a numeric column for every alpha column that needs to be sorted in a specific order. This is because Power BI columns always sort in alpha numeric order. So the month column will sort in the order Apr, Aug, Dec, Feb instead of Jan, Feb, Mar, Apr. You need to include a numeric month column so you can tell Power BI to sort the alpha month column in a different order. Use the “sort by column” button inside Power BI to change the default sort order of the alpha column. Also note that the numeric sort column should have a 1 to 1 relationship to the alpha column. i.e. there should be 1 and only 1 value in the numeric column for each value in the alpha column. (note, this is the easiest way to deploy, however note that technically it doesn’t have to be 1 to 1. Read about that in Daniil’s blog here )


How to Connect Data Tables to a Calendar Table
Load your calendar table into the Power BI data model. You then need to join your data table(s) to the calendar table using the date column from both tables. It is also possible to join your data table to the calendar table using a date key column (surrogate key) instead of a date column. This is most common when your calendar table is a different level of granularity than “day”, eg week, month etc.
Below I have joined a data table to the calendar table using the date columns in both.

How to Create a Power BI Calendar Table
There are several ways to create a calendar table for Power BI.
- Load it from a data warehouse (if you have one)
- Build one in Excel
- Build one in Power Query
- Use DAX table functions
Excel Calendar Tables
I think that Excel is the most flexible because you can hard code any value you need. This can be good if you have variable business rules as to when your year starts (eg for 445 calendars). Just create a blank worksheet and start adding the columns you need. You can use formulas in your columns to calculate the values for Year, Month etc. Eg you can use =YEAR([Date]) to create a year column from your date column, although this generally only works for regular calendars (not 4/4/5 calendars etc). Just hard code the values that don’t follow any formula logic.

Import the data from your Excel workbook into every Power BI workbook where you need a calendar table.
Power Query Calendar Tables
My preferred approach to building a calendar table is to use Power Query. Once you write the query it is “set and forget”. The table will automatically grow as time progresses (not something that will happen with Excel). I have a separate blog article on how to do this in Power Query.
https://exceleratorbi.com.au/build-reusable-calendar-table-power-query/
If you want to learn Power Query, checkout the details of the Power Query Online training course.
DAX Table functions
While it is possible to build a calendar table using DAX functions, I do not recommend this approach. I believe in using Power Query to prepare the data where possible, hence that is my recommendation for most use cases. You can use the SQLBI calendar table template if you want to use DAX. But be warned, the DAX is 1,500 lines of code.
How to use a Week or Month Calendar
So far I have only talked about daily calendars. If you want to use the inbuilt time intelligence functions then you must use a daily calendar as described above. However if your data is at a weekly or monthly level of granularity and you don’t want/need to use the inbuilt time intelligence functions, then you can use a week or month calendar instead. The difference is that the in-built time intelligence functions won’t work. Note you can still create your own custom time intelligence formulas but the DAX is generally harder to write (intermediate level DAX).
E.g. Instead of this
Total Sales FYTD =
     TOTALYTD([Total Sales], 'Calendar'[Date], "30/6")
You would need to write something like this
Total Sales FYTD =
     CALCULATE(
          [Total Sales],
          FILTER(ALL('Calendar'),
                 'Calendar'[FinYear] = MAX('Calendar'[FinYear]) &&
                 'Calendar'[FinWeek] <= MAX('Calendar'[FinWeek])
          )
     )
I have a comprehensive blog article about time intelligence here https://exceleratorbi.com.au/dax-time-intelligence-beginners/
In addition, in a weekly or monthly calendar, you generally don’t use a date column but instead create some other unique time stamp ID to join the tables. e.g., you can create a column like YYYYWW as the key (2101 for Week 1 2021, 2102 for Week 2 2021 etc). Just make sure the same logic is used in your calendar table and also in your data table(s). Same applies if you want to use months as your data granularity. This is a snippet of a typical weekly calendar that would use the FinYearWeek column as the key to join to the sales table.
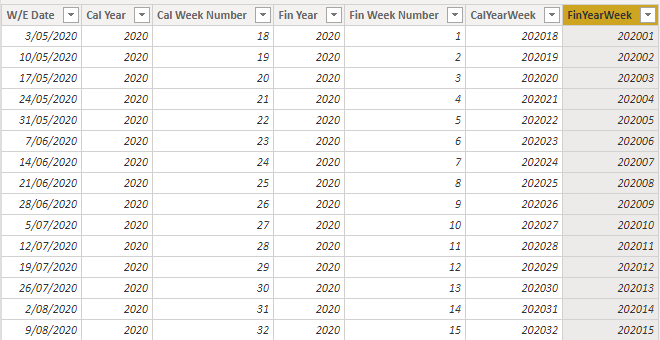
Note that it is important to use YYYYMM and not MMYYYY for a key column. YYYYMM will naturally sort in chronological order where as MMYYYY will not.
I do not even know the way I stopped up here, but I assumed this put up was good. I don’t realize who you might be however certainly you are going to a well-known blogger should you aren’t already 😉 Cheers!
I like this website so much, saved to bookmarks. “American soldiers must be turned into lambs and eating them is tolerated.” by Muammar Qaddafi.
Hi there, You have done an excellent job. I will definitely digg it and personally suggest to my friends. I am confident they’ll be benefited from this site.
I really enjoy studying on this site, it holds good articles.
Very efficiently written story. It will be beneficial to anybody who employess it, including yours truly :). Keep doing what you are doing – can’r wait to read more posts.
As a Newbie, I am continuously searching online for articles that can help me. Thank you
Magnificent beat ! I wish to apprentice while you amend your web site, how can i subscribe for a blog website? The account aided me a acceptable deal. I had been tiny bit acquainted of this your broadcast offered bright clear concept
Thank you for the auspicious writeup. It in fact was a amusement account it. Look advanced to more added agreeable from you! However, how can we communicate?
I haven’t checked in here for some time since I thought it was getting boring, but the last several posts are great quality so I guess I will add you back to my daily bloglist. You deserve it my friend 🙂
I dugg some of you post as I cerebrated they were very beneficial handy
Hmm is anyone else experiencing problems with the pictures on this blog loading? I’m trying to find out if its a problem on my end or if it’s the blog. Any feedback would be greatly appreciated.
I am continually searching online for posts that can help me. Thanks!
I got what you mean ,saved to fav, very nice web site.
I feel this is one of the most significant information for me. And i am glad studying your article. But should commentary on few general issues, The website taste is perfect, the articles is really excellent : D. Good process, cheers
Thank you for another fantastic post. The place else may anybody get that kind of information in such a perfect manner of writing? I have a presentation subsequent week, and I’m on the look for such info.
Hi there very cool website!! Guy .. Excellent .. Wonderful .. I’ll bookmark your blog and take the feeds alsoKI am satisfied to find so many helpful information right here in the put up, we need work out more techniques on this regard, thank you for sharing. . . . . .
Wonderful paintings! This is the kind of information that are meant to be shared around the internet. Disgrace on Google for not positioning this submit upper! Come on over and talk over with my website . Thanks =)
I found your weblog website on google and examine a few of your early posts. Continue to keep up the excellent operate. I simply extra up your RSS feed to my MSN News Reader. Seeking ahead to reading extra from you later on!…
Its like you read my mind! You appear to know a lot about this, like you wrote the book in it or something. I think that you could do with a few pics to drive the message home a little bit, but instead of that, this is great blog. A fantastic read. I’ll certainly be back.
An interesting discussion is value comment. I believe that you should write extra on this topic, it won’t be a taboo topic but usually persons are not sufficient to speak on such topics. To the next. Cheers
I savour, result in I discovered just what I used to be taking a look for. You’ve ended my four day long hunt! God Bless you man. Have a great day. Bye
Respect to website author, some good entropy.
Dead written content material, thank you for information. “You can do very little with faith, but you can do nothing without it.” by Samuel Butler.
You actually make it seem really easy together with your presentation but I find this matter to be actually one thing that I believe I might by no means understand. It sort of feels too complex and extremely broad for me. I am taking a look ahead in your next post, I’ll attempt to get the hold of it!
This website really has all of the information and facts I needed about this case and didn’t comprehend who to ask. http://www.haxorware.com/forums/member.php?action=profile&uid=396502
I love your writing style truly loving this internet site.
purchase xenical sale – https://asacostat.com/# order xenical 60mg for sale
Wonderful blog! I found it while searching on Yahoo News. Do you have any tips on how to get listed in Yahoo News? I’ve been trying for a while but I never seem to get there! Thank you.
dapagliflozin 10mg tablet – https://janozin.com/ dapagliflozin 10mg usa
Good – I should definitely pronounce, impressed with your website. I had no trouble navigating through all tabs and related info ended up being truly simple to do to access. I recently found what I hoped for before you know it at all. Reasonably unusual. Is likely to appreciate it for those who add forums or something, site theme . a tones way for your client to communicate. Excellent task.
Good blog you procure here.. It’s severely to assign great quality article like yours these days. I truly appreciate individuals like you! Go through guardianship!! http://www.fujiapuerbbs.com/home.php?mod=space&uid=3616674
Hi my family member! I wish to say that this article is amazing, nice written and include almost all significant infos. I would like to look extra posts like this .
This website positively has all of the bumf and facts I needed about this subject and didn’t identify who to ask.
flomax generic
I couldn’t turn down commenting. Well written! https://ondactone.com/product/domperidone/
Appreciating the time and energy you put into your blog and detailed information you offer. It’s great to come across a blog every once in a while that isn’t the same out of date rehashed material. Wonderful read! I’ve saved your site and I’m adding your RSS feeds to my Google account.
top rated canadian online pharmacy
non prescription drugs
non prescription
india online pharmacy
canadian pharcharmy online
online prescription
most trusted canadian pharmacy
canada pharmacies online
online meds no rx reliable
online pharmacies in usa
meds canadian compounding pharmacy
Can I simply say what a reduction to seek out somebody who truly is aware of what theyre talking about on the internet. You definitely know tips on how to bring an issue to mild and make it important. Extra folks need to learn this and perceive this aspect of the story. I cant consider youre no more in style since you positively have the gift.
More delight pieces like this would insinuate the интернет better. https://ursxdol.com/amoxicillin-antibiotic/
Very interesting details you have mentioned, appreciate it for posting. “Brass bands are all very well in their place – outdoors and several miles away.” by Sir Thomas Beecham.
With thanks. Loads of knowledge! sitio web
Greetings! Extremely serviceable par‘nesis within this article! It’s the crumb changes which choice obtain the largest changes. Thanks a quantity for sharing! https://buyfastonl.com/azithromycin.html
I have been absent for some time, but now I remember why I used to love this web site. Thank you, I will try and check back more frequently. How frequently you update your site?
ranitidine 300mg canada – click purchase ranitidine online
buy cenforce 50mg generic – https://cenforcers.com/ order cenforce 50mg sale
Hi friends, how is the whole thing, and what you would like
to say concerning this piece of writing, in my view its truly remarkable in favor
of me.
purchase diflucan online cheap – buy fluconazole 200mg sale buy forcan
buy generic amoxicillin – buy amoxicillin without a prescription cost amoxil
Real nice design and excellent subject material, nothing at all else we need : D.
Its such as you read my mind! You seem to grasp so much approximately this, like you wrote the ebook in it or something. I believe that you just can do with some percent to pressure the message house a bit, however instead of that, this is great blog. An excellent read. I’ll certainly be back.
Adorei este site. Pra saber mais detalhes acesse nosso site e descubra mais. Todas as informações contidas são informações relevantes e exclusivos. Tudo que você precisa saber está está lá.
Very interesting topic, regards for posting.
This website online is really a walk-via for the entire info you needed about this and didn’t know who to ask. Glimpse here, and also you’ll undoubtedly discover it.
Magnificent site. A lot of helpful info here. I am sending it to some buddies ans additionally sharing in delicious. And naturally, thank you for your sweat!
Hello.This post was really interesting, particularly since I was searching for thoughts on this matter last Sunday.
Usually I do not read article on blogs, but I wish to say that this write-up very forced me to try and do so! Your writing style has been surprised me. Thanks, very nice article.
Good post, Matt. What are your thoughts regarding a calendar table only including the dates in your fact table vs. having a calendar table which has dates prior/after the dates in the fact table?
Thanks for your input.
When you say “only including the dates in your fact table” I assume you mean that they are bound by the earliest and latest dates. You definitely want to load every date in the period in a calendar table – it must be a superset. Regarding starting at the beginning of the year and pushing out to the end of the year, this is a “requirement” if you are going to use the inbuilt time intelligence functions (such as DATEADD). If you write your own custom time intelligence, then it is not required. Personally, I have written plenty of inbuilt time intelligence functions that work just fine without extending the date range, but I do recall 1 that didn’t work. If you want to be safe, then extend them back and forward. The downside of pushing forward is that you get calendar over run (I have a video about to drop on YouTube about that).
“The table will automatically grow as time progresses (not something that will happen with Excel)”
If you have Excel 365 then you can make expand automagically 🙂
In A1 – Type 2017
In A2 – Type YEAR(TODAY())
In B1 – You can type =SEQUENCE(DATE(A2,12,31)-DATE(A1,1,1)+1,1,DATE(A1,1,1),1)
This will generate a Dynamic Spill Array of Dates for 01-Jan-2017 till 31-Dec-Current Year
The Rest of the Columns of the Calendar can be based on this Spill array
Cheers
Sam
My assumption is that this will not work unless you open the Excel file (so it updates) and then save the file. This would seem to defeat the objective of making it automatic.
That is true, TODAY() is a volatile functions. Something needs to trigger the recalculation in the workbook. Simple open&close would do the trick but as You mentioned – this part kills the automatation objective. Great article!
Very good article.
Hi Matt,
A little quirk I found playing around with a calender table. I created a table in Excel and “pasted” it into Power Pivot.
The first 12 days of each month changed from “dd/mm/yy” (Aust setting) to “mm/dd/yy” (US setting). The remaining dates (13th to 30th etc) were fine.
I did as you have explained and created a separate table in a separate file and all is fine.
cheers,
Scott
Hi Matt, Its been so hard to customise week number based on dates , but I see you have done nicely in your sheet. ID for week which is customised. Using the function WEEKNUM gives the weeknumber starting from JAN till Dec which is not my purpose.
Please show how to customise the week ID number
The reason there is no standard option here is because there is not standard. I have this on my list of blog articles to write in the future. If you can email me a set of repeatable rules that tell me how your week number is calculated, I can take a look.
Hi Matt, I can’t seem to find a formula that works with Month ID (not even on the links you post to other blog).
Can you help me in using MonthID to refer to last month? How does the dax know the ID of the current month?
Hi Matt.
How would I calculate previous month total sales if my date table is on a monthly granularity when using a date key? (ie YYYYMM format). I want to calculate the MoM change to compare previous months budget to this current month. I cannot simply use DATEADD functions as I cannot use the inbuilt time intelligence in this scenario.
Any help would be appreciated here as I cannot seem to find a solution online anyway for my problem. I have tried this formula but it is returning an error:
Total Budgets LM =
CALCULATE (
[Total Budgets],
FILTER (
ALL ( ‘Calendar Creation Table'[DateKey] ),
FILTER (
VALUES ( ‘Date'[DateKey] ),
‘Date'[DateKey] – 01
= EARLIER ( ‘Calendar Creation Table'[DateKey] )
)
),
ALL ( ‘Date’ )
)
You are close. Read my article here https://exceleratorbi.com.au/dax-time-intelligence-beginners/
Then, make sure you have a MonthID Integer column in you calendar table, starting at 1 and increasing by 1 for every month, forever. eg month 1 in the second year will be 13. Month 12 in the second year will be 24 etc. You then use this Month ID column in your formula (following the instructions I provide on the page linked above). Post back how you go.
Hi Matt.
Went extremely well.
I now have the MTD figures for previous months, as well as 2 months ago. I struggled with this a lot at first, so thank you so much for your help and great article.
Hi Matt,
If my data table is reporting monthly granularity, do I need to have a calendar table that is using daily granularity? I can’t see how I would be able to create a relationship between the two if they’re not using the same granularity.
You don’t need a day calendar if your data is monthly. Just create a yymm column in both to join the tables. Be aware that inbuilt time intelligence won’t work – you have to write your own custom time intelligence. Read my time intelligence in my knowledge base
Hi Matt,
I have created a calendar table in Power BI and I can sort by month. My data start from Jun 2016 to March 2017. The problem comes when the year increases – from 2016 to 2017. Then the date is displayed as 2017 months first and then 2016 months. i.e. Jan, Feb, Mar, Jun, Jul, Aug…….
I tried creating a column YYYYMM and tried to index the month name using that column in DAX. But I get an error “.. You cannot sort the Month Name column by YearMonthIndex. You cannot have more than one value in YearMonthIndex for the same value in Month Name.”
How can I sort the months so that the roll over of year will not cause a problem?
Thanks in advance.
Hi Anand, I would be happy to help you. Can I please ask that you create an account at http://powerpivotforum.com.au and post a sample workbook with the calendar table that you already have. Someone will help you there (if not, then definitely me).
Hi Matt,
I was working on one report and couldn’t actually complete it on PowerBI due to my limited knowledge. I have been asked to created a bar graph that shows previous years performance on right side like one bar for 2014, one for 2015 and then current years months and at the end it should show me YTD. Is it possible to do it on powerbi
I suggest you post a question at http://powerpivotforum.com.au As this is the best place to have such a discussion, and for others to learn too.
Hi Matt:
I have followed the steps from various online sources to create a calendar file. I created a relationship for the calendar table to the functional table. When I drag a calendar field (month or quarter) in to columns or rows, they appear as expected. When I pull data from the other table, the data fields disappear. I have researched for the last few days and checked formatting for the joined date fields. Nothing seems to be working. The date field on my data table does include time values. I suspect this is the culprit based on articles and videos I’ve research, but I can’t find the right solution to correct the problem. Can you help?
Yes, the time stamps would cause this problem. You need to strip the timestamps off your data. The best way is to do this on data load. Can you load the data from Power Query? If so, you can convert from date/time to date prior to load. This is the best approach. If this is not an option, you could add a new calculated column in your data table and write a formula to display just the data portion. This is very inefficient and I don’t recommend it, but at least you could test that this solves the problem. I am sure it will.
Hi Andre
ALLSELECTED will respect the initial filter context on slicers and filters (ignoring rows and columns). So if you have 2 slicers (one for year, one for month) it will respect both. The process to solve these problems is to think in “English” (not DAX) about the steps to solve the problem (while thinking like the power pivot engine), then converting the solution to DAX.
In English: you want to remove all current filters from the initial filter context and then reapply a new filter only to the current selected year. So how about harvesting the year selected using an aggregator and then re-apply a filter to that year only. Something like this.
=CALCULATE([measure] , FILTER(ALL(Calendar) , calendar[year]=max(Calendar[Year]) ) )
Thank you Matt, that works a treat. I extended the concept to an AVERAGEX function with great success (bye-bye calculated column chewing up all my memory!)
Hi Matt, when using monthly granularity for the date table, how would I calculate the annual total of an expression for a year selected on a slicer regardless of the month selected on a different slicer?
I’m having trouble understanding the difference between these trial and error attempts and why they invariably end in error:
=CALCULATE([Measure],FILTER(Calendar, all(Calendar[Month of year]);
=CALCULATE([Measure],FILTER(Calendar, allselected(Calendar[Year]);
=CALCULATE([Measure],FILTER(all(Calendar), allselected(Calendar[Year]);
=CALCULATE([Measure],FILTER(Facttable, all(Calendar[Month of year]);
And other permutations of the above.. some give me incorrect results and others are nonperformant to the point of forcing me to reach for the Esc key.
What am I missing here?
The only way I know to do that is with the Excel approach mentioned above (but it would work with SQL Server etc too). You have 1 master workbook for your calendar and import it in each workbook where you need it. But it is hard to manage the over run issue this way. The trouble will always be if you add/delete a column, it won’t auto flow into each workbook. You will need to go to table properties and change the column settings to make it flow. But that is pretty easy.
Currently the approach I take is to save my power query code in a blank workbook and save it as a template. When I need a new workbook with a calendar, I just use that template. If I forget (which I do) I have the code saved in One Note and I just cut and paste it into a blank query. If I need to change it, I change it in my master template and then update my copy in One Note. When I get to a workbook that needs updating, I just replace the Pq code at that time. Not ideal, but at least this way your calendar is getting incrementally better each time. At some point you will have nailed it and won’t need any more changes. If you don’t have everything I mentioned above, I recommend you add these things. You can always filter out columns you don’t need, or just leave them in – they won’t hurt.
Interesting approach that I need to study…the more I read about powerquery the more I think I need to take a bunch of time and learn it like I have powerpivot.
Right now I’m trying to reduce the number of files to reduce duplication of tables such as the calendar but I’m getting to the point where some of the files are starting to show performance issues.
Thanks for the quick repsonse!
Mike
Matt…
Nice post….
Do you have any suggestions for keeping calendars in sync in multiple files? I’m finding I need more than one powerpivot file (likely will settle on 3) but need the same calendar in each. I tend to make additions to one calendar and then realize I need to update the other 2 files.
Mike