If you don’t know (or are not 100% sure) what a Power BI Data Model is, you have come to the right place. I see a lot of people confused as to this term “data model”, and frankly I don’t blame anyone for being confused – it’s a foreign concept to most non-IT pros. In this article I explain what a data model is so it will make sense to you. I have learnt what I know about data modelling over many years by reading articles from many and wide sources (as you are now, too).
What is a Data Model?
In short, a data model is the collection of
-
loaded tables of data
- with one or more columns that have been loaded for a reason (don’t load any columns from your source into your model unless you have a reason).
- with one or more rows of data that have been loaded for a reason (don’t load rows from your source into your model unless you have a reason).
- relationships between the loaded tables
-
the measures (formulas) written that apply the business rules to the raw data to extract business insights (e.g., sell price minus cost price is profit), including
- the formulas themselves
- the formatting applied to the formulas
- the business names given to the formulas
All of the above make up what is referred to as “the data model” in Power BI (also for Analysis Services Tabular, Power Pivot for Excel and no doubt countless other BI tools).
Why Do I Need a Model?
Power BI is a data model based BI reporting tool; not all BI tools are data model based. One example of a non-data model based BI tool is SQL Server Reporting Services (SSRS). SSRS is a non-data model based BI tool. Non-data model based BI reporting tools require the report writer to first generate a query to fetch the data from a database (typically SQL Server) and return the results of that query to SSRS so the results can be rendered in a report. Many non-data model based reporting tools have a user interface that helps with the generation of the query (if you want to use it), or you can also use a scripting language like T-SQL to fetch the data that you need for each report.
A second example is Excel. Traditional Excel is also a non-data model based BI tool. By traditional Excel, I mean Excel the spreadsheet tool without the modern BI add-ins of Power Query and Power Pivot. In the case of traditional Excel, the user loads the data into the spreadsheet and then logically relates and aggregates the data using Excel formulas and builds a report (often on a new sheet) to summarise and present the results (the report).
Now don’t confuse “a tool” here with “a data model based tool”. Excel is definitely a tool – it is a very flexible tool that lets you build virtually any report without being a programmer. In fact I think Excel is probably the best and most popular BI tool ever invented. But it is not a data model based tool – because it doesn’t have a data model.
There is nothing wrong with using a non-data model based BI tool – it is just that it is a different approach to using a data model based tool. The biggest “issue” with non-data model based reporting tools is that every time you need a new report, you have to start again, often from scratch. Each report has a single purpose with very little reusability or extensibility.
The benefits of a data model based tool like Power BI are:
- the author of “the data model” builds a reusable capability (the data model) that can be used to solve the current reporting requirements as well as (often) future requirements without the need to go back and write further queries to retrieve a new subset of data.
- The author can often be a business user (normally with good Excel skills) – they don’t have to be a professionally trained database administrator or SQL professional.
- The model is “conceptual” in nature, supported by a user friendly interface that let’s you “build” the model logically with the minimum of coding. Note: You will need to do some coding (writing formulas) for a good model, but no harder than you average Excel spreadsheet once you have the skills.
The Model View in Power BI Desktop
Inside Power BI Desktop you will find the “model view”. The image below shows the tabular structure of the Adventure Works database I use for most of my demos.

Above you can see:
- The tables
- The columns in the tables (although this is not the best view for columns – better to use the data view for that)
- The relationships between tables (if they exist)
- The types of relationships (the ones above are all “1 to many”)
- The direction of filter propagation between the tables using the relationships
What you can’t see in this model view are the measures (the formulas that generate the business concepts from the raw data).
Measures Are Part of Your Model
As I mentioned a few times already, measures are part of your data model. Measures are the set of standard instructions that tell Power BI how to extract the business concepts and these form part of your data model. Let me illustrate with an example.
Consider the column ExtendedAmount from the sales table (shown below).
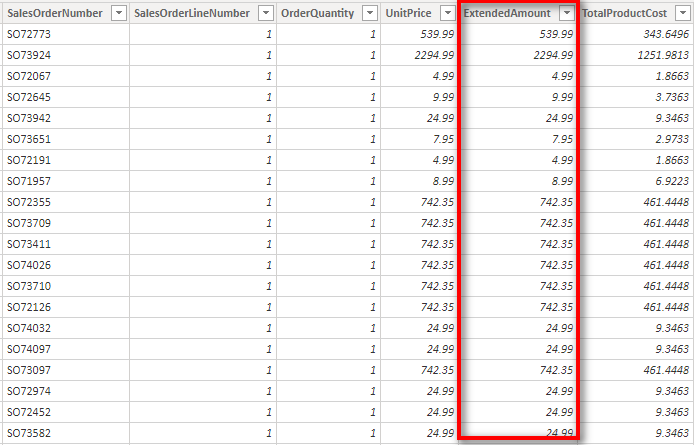
This is a column of numbers that is stored in the sales table in the data model. These numbers represent the total value of a line item of sales (one row in the table is one line item). E.g. if you purchased 2 products at $5.00 each, the ExtendedAmount would be $10.00. It therefore follows that
- If I add up the column, it tells me the total value of all sales transactions
- If I count the values in the column, it will tell me how many sales line items there are across all sales.
- If I average the values in the column, it will tell me the average value spent across all product items by customers.
- If I found the maximum value in the column, it would tell me the largest single line item value that has occurred.
Power BI is more than capable of doing all of the above without the need for you to write any formulas. But Power BI has no concept of what each of the above formulas mean in a business context. It can do the calculations, but it can’t give you a good business name for the result, nor pick the most appropriate numeric formatting for the result. If you want those things, you need to do it yourself. You need to extend the data model to include measures (formulas) to meet your needs. You could write the following measures:
Total Sales Value = SUM(Sales[ExtendedAmount])              format as Currency, 0 decimals
Total Line Items = COUNT(Sales[ExtendedAmount])             format as whole number, comma separated
Average Line Item Value = AVERAGE(Sales[ExtendedAmount])    format as Currency, 2 decimals
Maximum Line Item Value = MAX(Sales[ExtendedAmount])        format as Currency, 2 decimals
These are just simple examples that work on a single column of data. All of these can be calculated by Power BI without the need to learn any of the DAX formula language. But if you want something more complex (and probably more useful), then you will definitely need to learn some DAX to get the most out of Power BI.
Your Model is An Asset
I often think of a Power BI Data Model as an asset – something you build and improve upon over time. The more effort you put into your model, the more valuable it becomes. When it comes time to build a new report over your data, you do not start again (like you typically do with non-model based tools). Instead you take your asset (your data model) and reuse it again. If you are lucky, there is nothing to change and you can simply build a new report on top of your existing asset. Sometimes you will need to enhance your asset a bit to cater for the new requirement. In this case, you first build upon the asset you previously created and then build your new reports on top.
Further Reading
If you would like to learn more, I recommend reading some of my other article listed below.
- The difference between Shaping (with Power Query) and Modelling
- How to build a golden dataset so your “Model” is separate from your reports.
If you want to learn more about DAX, a great place to start is with my best selling book Supercharge Power BI – Power BI is Better When you Learn to Write DAX.
If you want to learn more about data modelling, you can check out the online training course Dimensional Modelling developed by Ken Puls, Miguel Escobar and myself. It is a comprehensive course that covers a lot of detail about how to model your data to solve your business problems.
Your article helped me a lot, is there any more related content? Thanks!
Well explained – open eye for fundamental understanding.
Wish you many more success Mr. Matt
Congratulations for the clarity of the explanation
SSRS can use a Power BI/Analysis Services dataset as a data source instead of SQL, so it could be a model-based tool. As a client, it is generally not model-based in that an end-user can’t directly use the model to make there own custom report.
SSRS is a query based tool – it has its own ability to generate the queries natively. As you say, it can also connect to a model based tool (such as PBI or SSAS) as an alternative. But that just means it can leverage other model based tools; it doesn’t make it a model based tool itself.
Gracias Matt. ?
Great post and long overdue. I especially like the nuances you drew between traditional Excel with no data model and Excel with the add-ons. Thanks!