I have been meaning to write this post for a long time – today is the day! The answer to the question “What is Power Pivot?“. You may also have landed here by searching for “Use this workbook’s Data Model”. Often the first time people discover Power Pivot is when they see this message in Excel 2016.

Let me start with what Power Pivot is not
I have heard lots of people describe Power Pivot as “Pivot Tables on steroids”. This is not a helpful description because it suggests that Pivot Tables are somehow changed in the process – this is not true – there is no change to how a Pivot Table works. If you want to find out what Power Pivot really is, then read on. But first let me clarify what a Pivot Table is.
What is a Pivot Table
A Pivot Table is a visualisation tool that can aggregate data from a data source (historically a single Excel data table) and display that data in a way that helps the reader make sense of the data. Let’s look at an example
Source Data Table
Here are a few rows of a simple Excel Table (ie a data source). Note there are more rows in this table that are not shown here to save space. This is my data source.
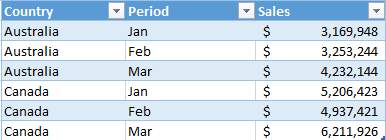
The trouble with source data like this is it is hard to find insights. Eg which country has the highest sales this year? It is hard to read typically because there is so much data and it is at a level of detail that makes it hard to consume. So we need a way to aggregate, summarise and display the data so we can make sense of it.
Pivot Table
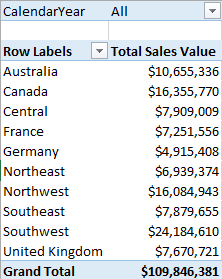
Here is a Pivot Table that uses the above source data. The Pivot Table is used to summarise and present the data to the user in a way that makes sense.
Further, you can use inbuilt Excel visualisation tools to make the data even easier to read, as can be seen below.
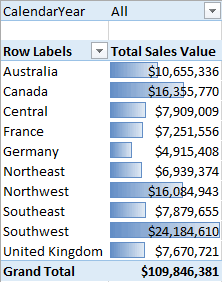
In fact Microsoft Excel is the world’s most commonly used tool for visualising data. It has had years of development and is a very mature, flexible and stable product that EVERYONE knows how to use. Excel is a GREAT TOOL for visualisation.
So what’s the problem?
Well there are quite a few problems actually.
- Historically Pivot Tables only allow the user to use a single source data table. That is OK for very simple data sets but it very quickly becomes a limitation. It is very common for source data to be split into multiple tables, particularly if you are getting the data from a database program. If the data are split in different tables, then it has been historically hard to use in a Pivot Table. In addition (and more recently with the advent of Cloud computing and social networking) people are sourcing data in different locations and wanting to compare these data as one. The Excel user then needs to use VLOOKUP (or similar) to bring the data into a single table before it is possible to create a Pivot Table. This very quickly becomes a problem for performance, setup effort and maintenance effort.
- Excel can only store 1 million rows of data, so forget trying to use Pivot Tables on really large data sets. (Actually, you can connect standard Pivot Tables to an Analysis Services Data Cube, but that requires expensive IT infrastructure and effort to build and maintain, so that is not considered viable for the average Excel user).
- Well before you hit the 1 million row limit, Excel will start performing very poorly, particularly if you have lots of VLOOKUPs etc. Excel it is not optimised for large database crunching work.
- Pivot tables are very good at aggregating data that exist in a suitable raw form in the underlying table, but are terrible in reporting on anything else that could be derived from the source data. In the example above the Pivot Table is just adding up all the Sales per country – easy. But what if you want to know the % change in sales in Feb this year vs Feb last year? Or which country has the highest profit margin. Although you can’t see all my source data, the data does actually have cost and sell, so it has all the data needed to complete this calculation. However it is one thing to have cost and sell in your data source, but it is another thing all together to be able to create a Margin % figure and report on it in a Pivot Table. Standard Pivot Tables are terrible at creating new ‘derived’ insights from raw underlying data.
So in summary, Pivot Tables are great for visualisation as long as your data is optimised in a way to leverage the power of Pivot Tables.
So What is Power Pivot?
Well as you may have guessed by now, Power Pivot is a tool that allows you to prepare your data in a way that Pivot Tables can use. Power Pivot is actually a data modelling tool. Power Pivot allows you to do the following
- Take data from one or more sources and combine it together into a single data source (this is called the data model).
- Enhance the underlying data so that you can create new derived concepts out of the data. So if you have Sales $ and Cost $ in your source data, you can create Margin $ and Margin % and make these new concepts available to a Pivot Table.
- The new concepts you build in Power Pivot are infinitely reusable in your Pivot Tables. In traditional Excel you need to create formulae in individual cells by pointing to other source cells. If you want to reuse a formula you have created on another Sheet that is not 100% identical to the first sheet, then you effectively have to rewrite the formula. This is not the case with Power Pivot. You write the formula once in the data model and then it can be reused over and over in as many Pivot Tables as you like.
- Power Pivot compresses the source data and stores it as a database within the Excel workbook. This means that you can store 10s (even 100s) of millions of rows of data directly in an Excel workbook in a highly compressed and performant way, and distribute it to other people without them needed to have access to the source database.
So Power Pivot is not “Pivot Tables on Steroids” because Power Pivot does not change the functionality of Pivot Tables. What Power Pivot does is change the source data so that you can use data that could not previously be used, and you can get more out of data that you previously used inside of a Pivot Table. So Power Pivot is actually your source data on steroids.
What’s More, Power Pivot has the Following Great Features & Benefits
- Any competent Excel user can learn Power Pivot. This makes complex data modelling that was previously only possible by engaging slow and expensive IT resources within reach of the average business analyst.
- Because of point 1, it is possible for business users to rapidly prototype and build business reporting and analysis tools in hours/days of work that would have previously taken months/years by engaging in a BI project. This makes analysis that was previously impracticable and impossible to justify within arm’s reach of an Excel user.
- Power Pivot was developed by the Microsoft SQL Server Analysis Services team and it has been built with the Excel user in mind as well as the SQL Server user. Any data model built in Excel by an Excel user can be quickly and easily migrated into SQL Server Analysis Services Tabular (SQL Server 2012+) and enhanced and/or operated as a robust IT solution. There is no need to start again from scratch if you want to take your Excel solution and make it an Enterprise solution.

So Where to from Here?
So that is what Power Pivot is, so what next? The only thing to do now is to start learning to use the tool so you can achieve greatness in your career. You can take a look at this online demo dashboard that gives you a “feel” of the end user experience. There are plenty of other great learning resources out there too, but the ones I recommend are:
- Read my book Learn to Write DAX. This book was written with Excel users in mind. I don’t think there is a better way to start your Power Pivot journey than with this book.
- Subscribe to Power Pivot Blogs to stay in touch with tips, tricks and general learning (just browse to the blog and find the subscribe button).
- Do some online training. I recommend my online training course that you can read about here
- Attend a live training class. I am an accredited and experienced Power Pivot trainer and you can find out details of my training courses here.
So what do you think? Does it all make sense now? Let me know if you have any questions and I will answer them here and update this blog post for the benefit of others.
More articles like this would frame the blogosphere richer. http://iawbs.com/home.php?mod=space&uid=916874
With havin so much content and articles do you ever run into any problems of plagorism or copyright violation? My website has a lot of unique content I’ve either authored myself or outsourced but it appears a lot of it is popping it up all over the web without my authorization. Do you know any ways to help protect against content from being stolen? I’d truly appreciate it.
I have been exploring for a little for any high-quality articles or blog posts on this kind of area . Exploring in Yahoo I finally stumbled upon this web site. Reading this info So i¦m glad to show that I have an incredibly excellent uncanny feeling I found out just what I needed. I such a lot for sure will make certain to do not disregard this site and give it a look on a constant basis.
xenical usa – https://asacostat.com/ where to buy xenical without a prescription
buy generic forxiga online – https://janozin.com/# pill dapagliflozin 10 mg
Thanks a bunch for sharing this with all folks you really realize what you are speaking about! Bookmarked. Kindly additionally seek advice from my website =). We may have a link alternate contract among us!
This is the gentle of literature I rightly appreciate. http://www.gearcup.cn/home.php?mod=space&uid=145813
The thoroughness in this piece is noteworthy.
buy generic topamax
This is the kind of scribble literary works I in fact appreciate. https://ondactone.com/simvastatin/
Hi, i think that i saw you visited my web site so i came to “return the favor”.I’m attempting to find things to enhance my site!I suppose its ok to use some of your ideas!!
Super-Duper site! I am loving it!! Will be back later to read some more. I am taking your feeds also.
La montre connectée Garmin fēnix® Chronos est un modèle haut de gamme avec un design élégant et connectivité avancée .
Conçue pour les sportifs , elle propose une polyvalence et durabilité extrême, idéale pour les aventures en extérieur grâce à ses outils de navigation .
Grâce à son autonomie allant jusqu’à plusieurs jours selon l’usage, cette montre reste opérationnelle dans des conditions extrêmes, même lors de sessions prolongées .
https://garmin-boutique.com/vivoactive/vivoactive-4s-vivoactive-4s-silver-avec-bracelet-gris-clair.aspx
Les fonctions de santé incluent le comptage des calories brûlées, accompagnées de notifications intelligentes , pour les amateurs de fitness .
Intuitive à utiliser, elle s’intègre à votre quotidien , avec un écran AMOLED lumineux et synchronisation sans fil.
More posts like this would prosper the blogosphere more useful. https://prohnrg.com/product/get-allopurinol-pills/
More articles like this would remedy the blogosphere richer. https://ursxdol.com/amoxicillin-antibiotic/
More articles like this would frame the blogosphere richer. gnolvade.com
Greetings! Very useful par‘nesis within this article! It’s the crumb changes which liking obtain the largest changes. Thanks a portion in the direction of sharing! https://buyfastonl.com/isotretinoin.html
buy generic ranitidine online – https://aranitidine.com/# ranitidine 150mg drug
cialis insurance coverage blue cross – https://strongtadafl.com/ who makes cialis
order cenforce 50mg – https://cenforcers.com/ order cenforce for sale
lexapro 20mg over the counter – https://escitapro.com/ order escitalopram 10mg without prescription
order fluconazole pill – https://gpdifluca.com/ order diflucan 200mg online
amoxil oral – amoxil online buy amoxicillin cheap
This actually answered my downside, thank you!
Respect to article author, some fantastic selective information.
demais este conteúdo. Gostei bastante. Aproveitem e vejam este conteúdo. informações, novidades e muito mais. Não deixem de acessar para descobrir mais. Obrigado a todos e até a próxima. 🙂
fabuloso este conteúdo. Gostei muito. Aproveitem e vejam este conteúdo. informações, novidades e muito mais. Não deixem de acessar para se informar mais. Obrigado a todos e até a próxima. 🙂
I do not even know how I finished up here, but I thought this put up used to be good. I do not recognise who you’re but definitely you’re going to a famous blogger for those who are not already 😉 Cheers!
Howdy just wanted to give you a quick heads up. The words in your content seem to be running off the screen in Safari. I’m not sure if this is a format issue or something to do with web browser compatibility but I thought I’d post to let you know. The layout look great though! Hope you get the issue solved soon. Many thanks
Nice post. I learn something more challenging on different blogs everyday. It will always be stimulating to read content from other writers and practice a little something from their store. I’d prefer to use some with the content on my blog whether you don’t mind. Natually I’ll give you a link on your web blog. Thanks for sharing.
Youre so cool! I dont suppose Ive read something like this before. So good to find any person with some unique ideas on this subject. realy thanks for beginning this up. this web site is something that is needed on the internet, somebody with a little bit originality. helpful job for bringing one thing new to the internet!
I conceive this internet site has got some very fantastic info for everyone :D. “This is an age in which one cannot find common sense without a search warrant.” by George Will.
Power pivot is an awesome tool. But it consumes lot of memory when applied filter function to the dimension table when there is huge data. And some time does not work properly. So any solution for this? Note I am working directly to sever via Citrix. So is there any solution how to avoid.
power Pivot is a very efficient reporting database. It can operate over hundreds of millions of rows of data perfectly well. It is possible to write inefficient formulas that don’t leverage the internal capabilities of the tool. I suggest you post your formula to http://powerpivotpro.com along with some information about your data model and ask for some help