Today Microsoft released the October 2018 update of Power BI Desktop. One of the fabulous new features that has been released is the ability to get a visual profile of your data in Power Query BEFORE you load the data. This new feature is typical of the type of development effort Microsoft is investing in with its products. MS is trying to make your life easier by helping you with the tools you need to do the job without you having to do everything yourself from scratch.
What is Data Profiling?
Data profiling is a process that data scientists use when wrangling with data. In short, it is a bit like taking a step back and looking at the overall shape and structure of the data. Kinda like looking at the overall forest rather than the trees. Let me show you how it is done.
Turn on the Data Profiling Preview Feature
Data Profiling is (at October 2018) a preview feature. Turn it on in the options settings
You will have to restart Power BI for the changes to come into effect.
Load and Profile Some Data
I am loading data from Adventure works. I have 5 tables that make up the data model. When I load the data using Power BI, I select Edit so it launches Power Query.
As a side note, it is very pleasing indeed to see Microsoft increasingly referring to the brand “Power Query” in the UI and conversations around the traps. Personally I believe that Power Query can be as strong a brand name as R or Python, if only Microsoft will allow the brand for the technology to have a life of its own even though it lives inside of products like Power BI and Excel.
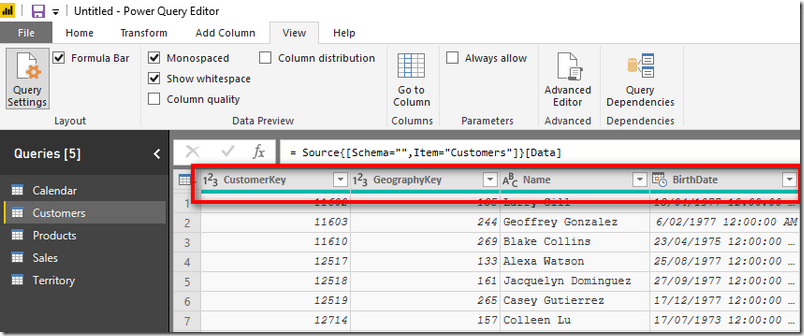
The first data profiling feature is very subtle. Note the green bar in the image below. If there are any errors in the columns, the percentage of errors will be indicated with a percentage of this bar being a different colour. Red for error, grey for empty, green for OK.
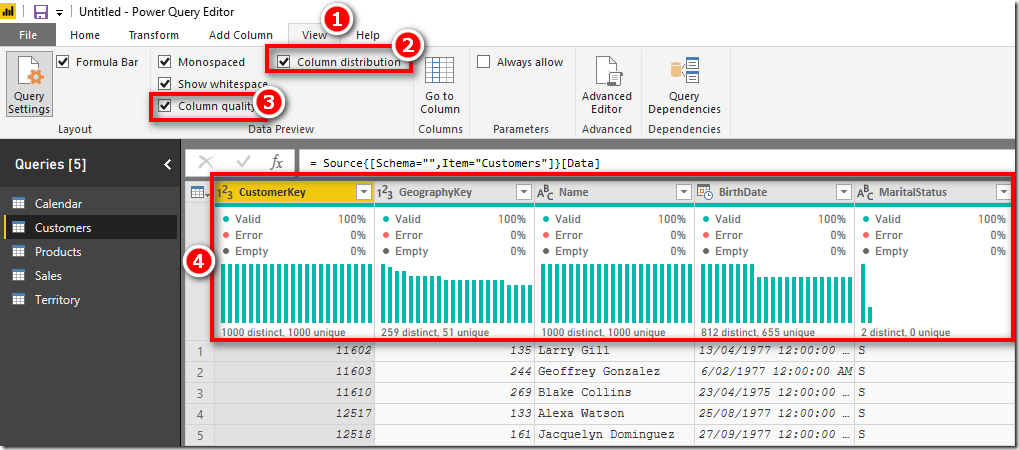
The next thing I did was I went to the View menu (1) and turned on Column Distribution (2) and Column Quality (3) as shown below. Then something wonderful happens – look at the data profiling information show in 4 below.
The data profiling tools look at the first 1,000 rows in the preview data loaded an shows you the big picture of what the data “looks” like.
Currently the profiling tool only works on the top 1000 rows of data. It also takes some time to prepare the profile of the columns (as could be expected), however the benefits of getting this stuff right before moving on far outweigh the slower load times (IMO). I would love to see an option to profile the entire set of data for one or more columns. I am sure this will come.
What do you think of this new feature? I love it.


You really make it seem so easy with your presentation but I find this matter to be actually something that I think I would never understand. It seems too complicated and very broad for me. I am looking forward for your next post, I will try to get the hang of it!
Good Content excellent resource for anyone looking to learn more about this topic. It’s well-researched, well-written, and very informative!
Fantastic site. Plenty of useful information here. I’m sending it to a few friends ans also sharing in delicious. And of course, thanks for your effort!
Hmm is anyone else encountering problems with the pictures on this blog loading? I’m trying to figure out if its a problem on my end or if it’s the blog. Any feed-back would be greatly appreciated.
I will right away clutch your rss feed as I can’t to find your e-mail subscription hyperlink or newsletter service. Do you’ve any? Please allow me know so that I may subscribe. Thanks.
I’d forever want to be update on new articles on this website , saved to favorites! .
I am really inspired along with your writing talents and also with the layout for your blog. Is this a paid theme or did you modify it yourself? Either way keep up the nice quality writing, it is uncommon to see a great blog like this one these days..
Thank you for sharing excellent informations. Your web site is very cool. I am impressed by the details that you have on this website. It reveals how nicely you perceive this subject. Bookmarked this web page, will come back for extra articles. You, my pal, ROCK! I found just the information I already searched all over the place and simply couldn’t come across. What an ideal web site.
Hi there I am so excited I found your web site, I really found you by error, while I was researching on Digg for something else, Anyhow I am here now and would just like to say thanks a lot for a remarkable post and a all round exciting blog (I also love the theme/design), I don’t have time to look over it all at the minute but I have book-marked it and also added in your RSS feeds, so when I have time I will be back to read much more, Please do keep up the great work.
Hello.This article was extremely remarkable, especially because I was searching for thoughts on this subject last Friday.
Thank you for the good writeup. It in reality was once a leisure account it. Glance advanced to far brought agreeable from you! By the way, how can we communicate?
Hey! Do you know if they make any plugins to safeguard against hackers? I’m kinda paranoid about losing everything I’ve worked hard on. Any tips?
Nice blog here! Also your website loads up fast! What host are you using? Can I get your affiliate link to your host? I wish my website loaded up as fast as yours lol
I love this feature. Is there a way to export the result?
No you can’t, but I created an idea for this last year. You can vote for it here https://ideas.powerbi.com/forums/265200-power-bi-ideas/suggestions/37343662-export-column-profiles-as-a-table
I love this option too. No need to go for SSIS for data profiling. The ability to show for every column, the percentage numbers and the error % is perfect. I would love to see the profiling for entire data set.
Apologies, also my deepest thanks to Erik, too
Thank you Matt and Imke.
We are looking at tool sets for enduring solutions, and Power BI as a short term fix on some aspects.
I will check out the link.
Btw, I got Jan 19 version of Power. I Desktop but it has no Data Profiling, not dies it gave Preview Features. Quite odd, I think.
Maybe you have the report server version. The new version of that is now out
Thanks Imke (and Erik)
Hi Anil,
these profiling visuals are not customizable.
Also, there is no real Regex-support in the M-language as one knows from other languages.
But you can define all sorts of rules with the M-language. You could for example create an additional column that checks these rules for one or more fields within one row/record.
This function has been provided by Erik Svensen and covers your specific scenario:
(valueToCheck) =>
let
l = Text.Length(valueToCheck) = 9,
startsWithLetter = List.Contains({“A”..”Z”}, Text.Upper(Text.ToList(valueToCheck){0})),
numbers = try Value.Type(Number.FromText(Text.Range(valueToCheck, 1, 8))) = type number otherwise false,
result = l and startsWithLetter and numbers
in
result
if you’re new to M-functions, check out this video on how to use this code in your solution: https://www.youtube.com/watch?v=6TQN6KPG74Q
Hi Matt
This is a brilliant post. I would like to know if I can specify DQ rules, ie, one field must be alphanumeric – 9 characters long, first letter beginning with a Capital letter – the other 8 characters are numbers
Thanks Matt for the wonderful post. I am more interested in Data Profiling and how we can export the statistics. For now I can view the stats, but cant export to xml/xls.
Is there any feature/way to export the stats?
I am not aware of a way to do that. Maybe do some investigation with Python or R, and/or create an idea at ideas.powerbi.com
Talk about being just-in-time! I am just wrangling data using dplyr and ggplot for my coursework assignment. And then Matt’s email arrives.
It was like a cool breeze on your face. So easy to profile the data using PowerBI.
Thank you so much for the timely tip.
Awesome. The pace at which Microsoft is bringing about new features is noteworthy. And they are all meant to make the life of the business user easy.