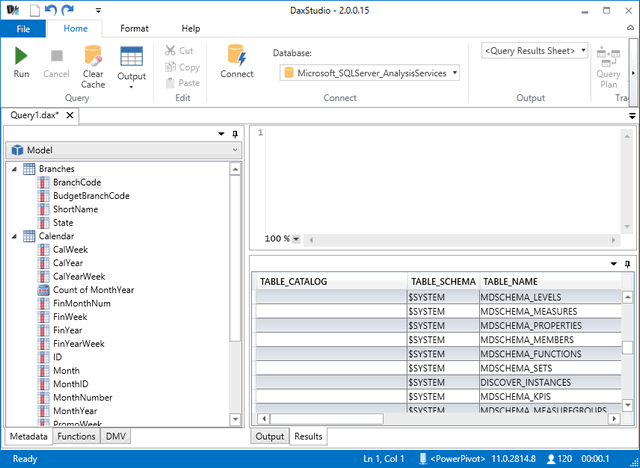
Great news for Power Pivot for Excel users – DAX Studio has had an update over night and version 2.0 is now available. For those of you that don’t know DAX studio, it is an ADDIN that you install for Excel 2010 or 2013. It connects to the Power Pivot Data Model and allows you to write DAX code, query the data model and also query the DMV (which means you can get a list of all the Measures and Measure formulae in your data model). DAX Studio 2.0 is worth downloading for that reason alone.
How to Install Dax Studio
You do not need to uninstall your old version. Just download the new version from here, close Excel and run the install. Install DAX studio into the same location as your original version – I just used the defaults and all worked fine. Once you start up Excel, you will find the same Icon on the Addin tab will work as before, but launch the new version.
If this is the first version you have installed, you first of all need to enable the Addin. Do the following in Excel
- Goto FileOptionsAddins
- Go to the bottom and find “Manage Excel Addins”
- Change the drop down box from Excel Addins and select COM Addins instead
- Click Go.
Once you have done this, there will be an Icon on the Addin Ribbon in Excel.

What’s New and Cool about Dax Studio
User Interface
The most obvious thing is a new user interface. It is very nice and clean. It now supports Hierarchies and KPIs in your data model, which was not the case before.

Choice of Output
My favourite change is the fact that you can now control where the output from your queries go, and there is an option to send to Excel with a “linked” copy.

This means that you can create a link to say the Measures in your data model, and allow people without DAX Studio to refresh the output when they want – very cool.
How to Extract your Measures
By far the thing I use DAX Studio for the most is to extract the measures from my data model into a format that is more readable. In order to do this, you should follow these instructions.
-
- Open the Excel workbook that contains your data model and also launch DAX Studio
- DAX Studio will prompt you to connect to your data model in the Excel workbook. Select Connect
- Select your Output Type. I have selected Excel Static as seen in the options above
- Down the bottom left corner of the screen, select the DMV tab

-
- Find the object MDSCHEMA_MEASURES and drag and drop in the query pane

- Press the Run button or F5 on your Keyboard to get the results
Another nice feature of this version is that the output is formatted as a Table. I am planning on writing some VBA to create “semi automatic” documentation of measures – maybe in my holidays!
Now there are A LOT more features for DAX Studio than I have covered here. The features I have talked about are the best ones I know of for Excel users however there are many more features that are particularly good if you have a SQL background (or are planning to learn more about DAX Queries).
How do you use DAX Studio? Please share your ideas to help others learn to get more for this great tool.


Love the new interface – thanks for broadcasting Matt.
I use the DISCOVER_CALC_DEPENDENCY instead of MDSCHEMA_MEASURES as it gives both the measures and also the measures that rely on that formula.
This can help in auditing what I’ve done. Taking the output table, I’ll filter column B and F to show measures only, then filter D to find the measure to investigate. That then shows not only that measures formula, but also the formulas of the measures it directly references. (Drilling down into the next level requires changing the filters as needed, but this first level is usually enough).
The output of this one also feels a bit cleaner than the measures one, with less strange columns that are I.T. speak for who knows what.
Mmmm, didn’t know about that. It looks very interesting and I like your idea of filtering. I will give this a go myself.