Level: Intermediate
Update: 2019. You can now do this natively in a Matrix, but this is still a good trick that can be used to solve various problems.
You may or may not be aware that it (previously was) not possible to put Measures on rows in a Matrix in Power BI. But I came up with a trick that makes it possible, so read on to find out how.
Measures Can Only be Placed on Columns
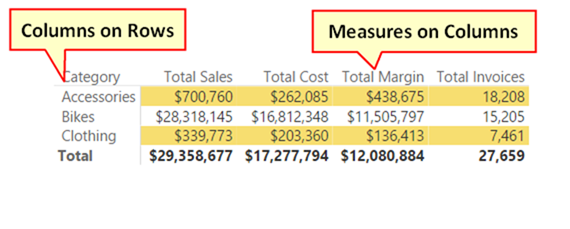
First the problem. The only way that you can use the Power BI Matrix visualisation (at this writing) is to place the measures on the columns as shown below. You can then take any column of data from your data model (typically from a Dimension/Lookup table) and place that on rows in the Matrix. So you end up with this.
This limitation does not exist in an Excel Pivot Table. As you can see below, it is possible to flip values between columns on rows from the Pivot Table Fields List.
Old tricks for New Purposes
When I was thinking through this problem, my first intuition was to use a Switch statement somehow. Switch statements can be used to create a Switch Measure (like the ones I used in this blog post here back in 2014) and I figured this could be part of the solution. And then I remembered another trick I learnt from Rob Collie using disconnected tables to feed a measure – I new I had a solution.
So in summary, I wrote a Switch measure that will morph into different measures when filtered, and then used a disconnected table to pass a filter to that measure.
Write a Switch Measure
The Switch measure is pretty easy to write as follows:
myMeasure=
     SWITCH([Selected Measure],
         1,[Total Sales],
         2,[Total Cost],
         3,[Total Margin],
         4,[Total Invoices]
     )
The way this measure works is that it takes an input in the form of an integer, and then depending on that number, it will return the value of the appropriate measure as the result.
Then Create a Helper Table
The next step is the secret sauce to this trick. I created a disconnected table with the sole purpose of passing the correct filter values (the integers) to the Switch measure.
I used the “Enter Data” feature in Power BI to create a list of the measures I want to put on rows in the Matrix.
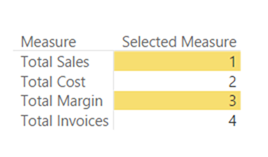
Note that the ID column is also the sort order of the measures, and the ID column also matches with the Switch measure numbering scheme. Once the table is created, I added it to the data model as a disconnected table – no need to join it to any other tables in the data model.
I then set the sort order of the Measure column as follows:
Write a Harvester Measure
The next step is to write a harvester measure to extract the selected filtered value of the table. This measure is simply as follows:
Selected Measure = MAX(MeasureTable[ID])
The measure above will return the largest integer in the current filter context. If there is a filter (eg a slicer) on the Measure column and the user as selected “Total Margin” in the slicer, then there is only a single row visible in the filter context, and hence the MAX of the visible rows is 3. I would of course get the same result if I used MIN, AVERAGE, SUM or indeed even VALUES in my harvester measure.
Filter context is one of the hardest things for new users to understand properly. I explain filter context in detail (and everything else you need to know to be great at using Power Pivot and Power BI) in my book “Supercharge Power BI”.
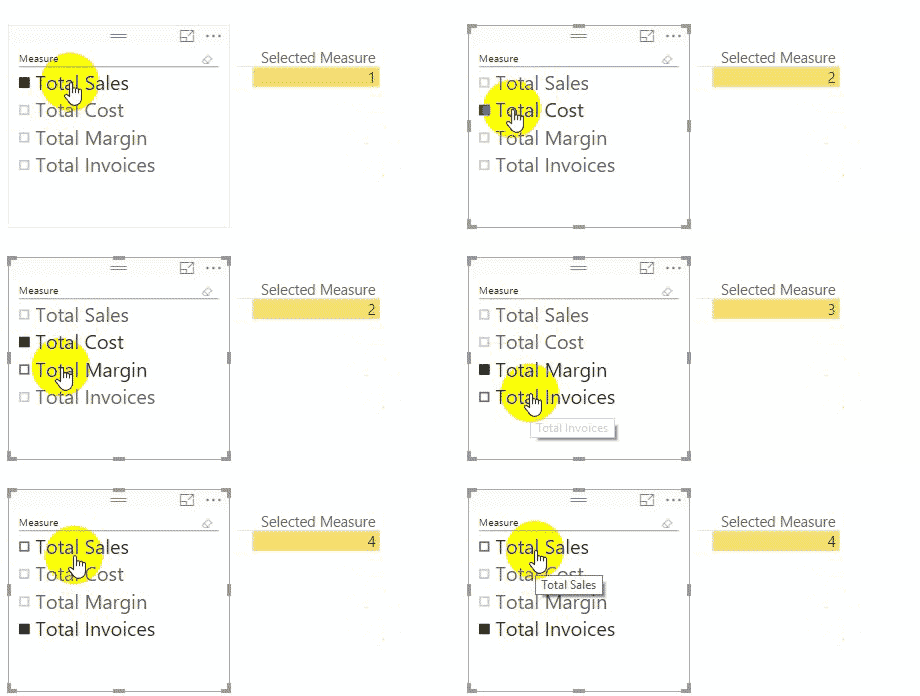
You can see the harvester measure in action below. I have placed the column from the MeasureTable into a slicer and the harvester measure into a Matrix. When I click on the slicer, the harvester measure updates to show the ID of the selected filter.
Add the Measure Column to the Matrix
There is more than 1 way to filter a table of course. In the image above I am using a slicer, but I can also use the rows on the Matrix to provide filter context. When I place the Measure column from the MeasureTable onto rows in the Matrix, you can see below that the harvester measure is correctly returning the value of the ID column to the visualisation.
Pulling it All Together
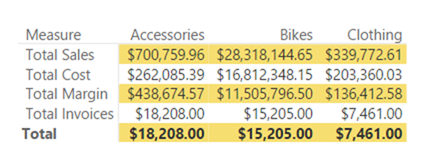
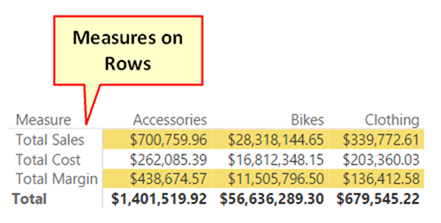
In order to pull this all together, I replaced the harvester measure with the Switch measure I wrote earlier, and put the Categories column from the Products table onto columns in the Matrix.
But there are now 2 problems. The first problem is that the Total Invoices are shown in currency format. One limitation of this trick is that all the measures must have the same number formatting. If you would like to see an optional “Alternative Format” for the SWITCH measure, please vote for that idea here.
The second issue is that the total row is actually showing the total invoices and not the total of all the measures. This makes sense of course because the grand total row is not filtered. As a result, the MAX of ID is 4 and hence the SWITCH measure is returning the value of the measure that maps to ID 4 (Total Invoices).
To fix these 2 problems, I removed Total Invoices from my table and rewrote the SWITCH statement to correctly handle the grand total row.
myMeasure =
      SUMX(MeasureTable,
              SWITCH([Selected Measure],
              1,[Total Sales],
              2,[Total Cost],
              3,[Total Margin],
              4,[Total Invoices]
              )
      )
And there you have it, Measures on Rows in a Power BI Matrix.




Wonderful website you have here but I was wanting to know if you knew of any community forums that cover the same topics discussed here? I’d really love to be a part of group where I can get advice from other experienced individuals that share the same interest. If you have any recommendations, please let me know. Thank you!
i did not understand it all, but it works. thank you
There is a way to format the individual measure – just wrap the measure in the Switch measure into FORMAT like this:
SWITCH([Selected Measure],
1,FORMAT([Measure 1],”#0″),
2,FORMAT([Measure 2],”#000″),
)
SIMPLY GO TO FORMAT VISUALS > VALUES>OPTIONS>SWITCH VALUES TO ROW >ON
Yes, as I said in the first sentence in the article above.
It’s brilliant, thanks for this. Although as you write, there is a native functionality now, this approach can be used in many other cases.
Options:
1. build a header table for rows and another for columns. Write 1 measure that responds to the intersection of both header tables to generate the result.
2. Look at InfoRiver visual.
I have a use case where I need to use measures to populate *both* the rows and the columns in a matrix. The column measures (8 different measures stacked in the “values” section of the matrix configuration) hold the various values that I want to return. (The “columns” section is blank). The function of the row measures would be to dynamically change the 3-level field hierarchy for the drill down in the matrix. My DAX all works, but unfortunately the “Row” section of the matrix visual won’t accept measures when there are stacked measures making up the columns (via the “values” section). Any ideas on a workaround?
Is there a way to customise which data you can see in each column. For example if it is split by years and the columns are split by two data groups, can you show one set of values for year 1 and both set of values for year 2?
I would like to have the measures as roll-up I.e in a hierarchy how can we do that
This is now standard behaviour with a matrix
Hi Matt this is pretty cool, thanks for share.
However I have a question for you if you don’t mind.
I am talking about a Pivot Table in Excel, If I have CONCATENATEX measure – Its only two text and does not contain values and I would like to display in ROWS-
At eh moment I am only able to display on Values, How could I display into the Fields Rows?
Could you help ? Any trick ?
A pivot table has 3 distinct areas, Rows, Columns and Values. you can only place a measure in the Values section, you cannot place it in the Rows section. If you want to separate the 2 items onto different rows, you should create a calculated column that returns the 2 possible values, and then you can add that to the Rows area.
How can you now connect the disconnected dashboard to the rest of the report
what do you mean?
Hi Matt
I’ve used this idea with great success in a custom matrix. Thank you very much.
What I would like to do next is, if Total Sales is greater than Total Cost then show the Sales value in Green and the Cost value in Red and so on.
I’ve created a third Switch measure to apply the font colours and applied it using the Field Value option under Conditional Formatting but this changes the font colours for all the values and not individually.
Can you please help?
Thank you.
Nevermind, I solved it.
Format Table =
SWITCH([Switch Measure],
[Sales],
SWITCH(TRUE(),
[Sales] > [Cost], “#3CB371”, “#FF6347”
),
[Cost],
SWITCH(TRUE(),
[Cost] > [Sales], “#3CB371”, “#FF6347”
),
“#FF6347”
)
you’re a life saver Yoshi! I never thought of nesting more switch statements for the solution.
hello Matt,
I am using exact the same method, but right now I have a requirement to use conditional formatting on one of the columns only for example I want to see colored font only on clothing category. Do you have any recipe for such an requirement?
Hello!
Thank you!!! Great alternative, really useful.
Could you help me?
I’m putting Grand Total in Matrix, but not is adding values, resulting in 0.
Follow my dax:
_BSC =
VAR Crisis = IF(CALCULATE(SUM(‘CrisesSev0&1′[Contagem]))>30;0;1)
VAR CrisisbyChange = IF(CALCULATE(SUM(MudancasCrises[Contagem])>2);0;1)
return
SUMX(PainelBSC;
SWITCH([_Selected Measure];
2;Crisis;
3;CrisisbyChange
))
It’s an old article – there’s a solution for this in PBI itself: https://powerbi.microsoft.com/en-us/blog/power-bi-desktop-august-2017-feature-summary/#valuesOnRows
Hi Matt Allington,
Great, Thank you very much.
I was struggling for this and i got the job done.
And i stucked up in oneline item i.e., Measure Rows i have percentage which i require in the format as
Occupancy % – 84%, 90%, like wise
GOP% – 50.2%, 49.20% likewise
Net Profit %. same as above.
Would be highly thankful and appreciated if you could resolve this issue as well
It can’t be done. See my comments towards the bottom of my article above and vote for the idea at the link I provided
Hi Matt! Thanks for this example. I had to do modify this a little bit because I needed to dynamically change a client status depending on the year I was looking the information, so I needed the rows depending on the value of a measure, and it worked! The SUMX final part didn’t work (I really don’t understand why, but nevermind). I just wanted to thank you for this!
Hi Matt,
I guess this will not work on live data right?
This is my current challenge as well. I need to perform several computations thru measures. If I create a matrix, the measures are only applicable to Values field, not in rows or column table,
What do you mean “live data”. Yes, measures only are applicable to values. You can put measures on rows now with a setting in the matrix.
What are the Performance implications ? Will Switch evaluates all the measures irrespective of conditions and then outputs only one matching condition ?
It’s complicated. The SWITCH function is compiled before it is evaluated. During that compilation phase, all the measures are expanded and a “quick” evaluation is completed to try to pre-validate those lines that are true or false. So it may, or may not have performance implementations. Besides, there is now a switch in a Matrix that you can use to put measures on rows
Thanks Matt. Yup I observed that in my measures and seems I need to rewrite my time intelligence switch to improve performance. Is this behaviour improved in SSAS 2019?
This workaround is no longer required, the Matrix layout now have under format for Values “show on row” that does this without coding
great post, the new Matrix always Values on ‘rows’. Does this new feature solve this problem, or did you solve a different problem. thanks
Yes, the core issue is now fixed in the updated Matrix. But this technique is still useful for doing things like creating a P&L that will auto fill into a matrix.
You created a Table so you are not using a measure in your row matrix field but the table you created. any way of using the measure directly working live on analysis server does not have the option of creating tables or calculated fields
Hello Matt!
Is it possible to insert differents number formats inside the Switch formula?
Yes and no. You can apply text formatting, but that is a bit of a hack. I have an idea that you can vote for to ask MS to make this happen https://ideas.powerbi.com/forums/265200-power-bi-ideas/suggestions/15231165-conditional-formatted-measures-using-switch
Hey Matt, great idea.
Can this approach be used in a SSAS Tabular model? I have managed to get it too work upto the point of getting the actual measure values to display.
Any ideas?
Cheers,
Ian
Think I’ve worked it out…
Hi Matt,
It seems to me that the TOTAL line in the matrix doesn’t make much sense since it sums the measures in the MeasureTable ignoring the fact that some are credits others are debits and intermediate results.
If instead you expand the MeasureTable with an extra column named ‘linekind’ with these codes:
1 = credits (sales etc.)
-1 = debits (cost etc.)
0 = intermediate results
The MeasureTable would then look like this:
Measure ID Linekind
Total sales 1 1
Total Cost 2 -1
Total margin 3 0
You could then use this adjusted measure instead:
=IF (
ISFILTERED ( MeasureTable[Measure] ),
SUMX (
MeasureTable,
SWITCH (
MeasureTable[ID],
1, [Total Sales],
2, [Total Cost],
3, [Total Margin]
)
),
SUMX (
MeasureTable,
SWITCH (
MeasureTable[ID],
1, [Total Sales] * MeasureTable[linekind],
2, [Total Cost] * MeasureTable[linekind],
3, [Total Margin] * MeasureTable[linekind]
)
)
)
The TOTAL will then usually show the same amount as shown in the last row if the last row is an intermediate result kind measure, if the last measure is not an intermediate result kind measure the total will show the end result.
The idea you came up with using a measure table to beat the measure constraint in the Matrix visual is brilliant. Hats off.
well, actually the measure can be simplified to this:
IF (
ISFILTERED ( MeasureTable[Measure] ),
SUMX (
MeasureTable,
SWITCH (
MeasureTable[ID],
1, [Total Sales],
2, [Total Cost],
3, [Total Margin]
)
),
SUMX (
MeasureTable,
SWITCH (
MeasureTable[ID],
1, [Total Sales] ,
2, [Total Cost] ,
3, [Total Margin]
) * MeasureTable[linekind]
)
)
Yes you are correct, it was just supposed to be illustrative. When I deploy such calcs, say in a P&L, I use columns for display sign, calculate sign and also display Y/N as part of the logic.
Arh, of course yes, but a brilliant idea you came up with.
Thanks for sharing Matt. There’s a few P&L reports that would benefit from that approach. In this specific example would you turn off Grand Totals or can you suppress them using HASONEVALUE or similar?
Hi Wyn
Yes I was doing P&L work when I came up with the idea. These 2 approaches will work of course, but I think I would build a SUMX so the totals add up. In my testing, it was all pretty performant.
Thanks Matt, keep up the great posts