I blogged about the various ways to use Measure tables and Measure Sub Folders in Power BI a few weeks back. I discussed why measure tables may be required, and also a few reasons why you may choose not to use a measure table. I also mentioned some alternatives to using measure tables, including using a sub folder for the measures inside the main data table. In this new blog article today, I will show you another (preferred?) way of grouping measures in Power BI. Instead of using measure sub folders, I am going to suggest that you use column sub folders.
Remember, you heard it here first 🙂
The Method
- When you write your measures, place them in the table where the data comes from, so that each of the tables will contain its own relevant measures.
- Then, in each table where you have written one or more measures, create a sub folder for all the columns in that table.
- Give a suitable name to the sub folder so that it floats to the top of the fields list.
Benefits of this grouping method
Benefits of creating a column sub folder instead of a measures sub folder for grouping measures in Power BI include:
- The sub folders are collapsed by default. All the columns will not be visible by default unless you expand the column sub folder.
- All the measures (what you want people to use) will be visible by default without having to expand a sub folder.
- All the measures are visible together in a single list, not separated by interspersed column names.
- When you write new measures, they will automatically appear in the list of other measures – no need to separately add them to the measures sub folder later (this doesn’t happen by default and becomes a second step).
- The measures are kept in the table they are created from and hence this improves the results coming from Q&A (see my earlier blog linked above for more details on this).

Example
I will illustrate this grouping method using the Adventure Works database.
As you can see below, the measures in the Sales table are scattered in the fields list. Our objective is to display the measures together so they are easy to find and use.
Create a Folder in the Sales Table for Columns
In the Model view, click on ellipses (#1 below) and then click on Select columns (#2 below).

Next, in the Properties window (#1 below) give a name to the Display folder (#2 below). You can see that all the columns in the Sales table are now grouped under the newly created sub folder (#3 below).
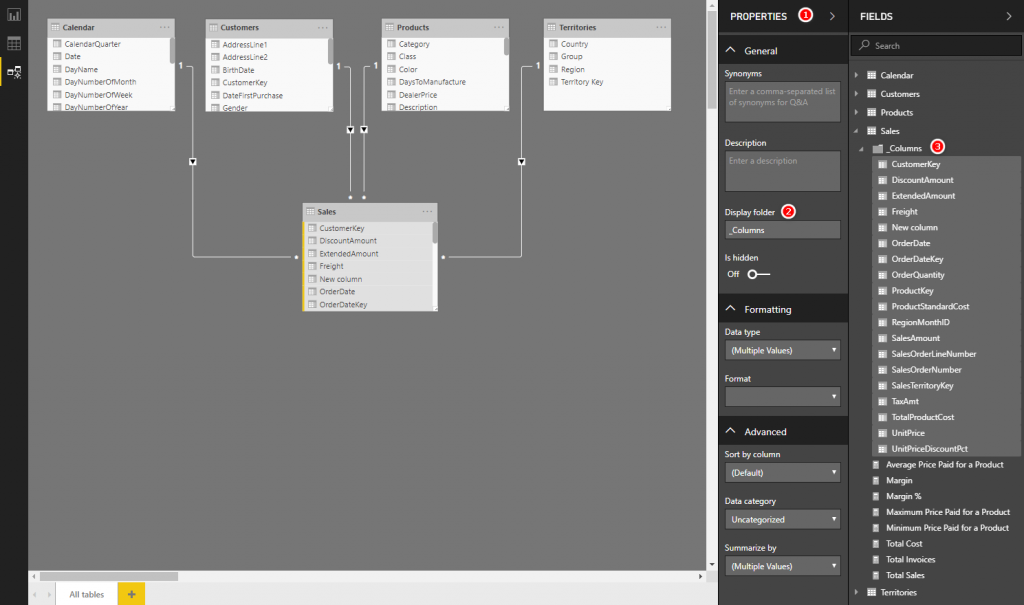
Switch over to Report view and you can see all the columns have been moved to the _Columns sub folder. Now all the measures are all visible together in one place in the table (#1 below). The columns are still there, but they are stored in the sub folder (#2 below).

Edit April 2020: With the integration of Tabular Editor with Power BI Desktop, it is now possible to move all columns into a Display Folder with Tabular Editor. You can find how to do it in my article here.
Great post. I was checking constantly this blog and I’m impressed! Very useful information particularly the last part 🙂 I care for such information much. I was seeking this particular information for a very long time. Thank you and good luck.
After examine just a few of the blog posts on your web site now, and I really like your manner of blogging. I bookmarked it to my bookmark website record and will likely be checking back soon. Pls try my web site as well and let me know what you think.
Thank you for the good writeup. It in fact was once a leisure account it. Look complicated to far brought agreeable from you! However, how can we keep up a correspondence?
You made some nice points there. I looked on the internet for the topic and found most people will consent with your website.
Hello there, I found your website via Google while searching for a related topic, your site came up, it looks good. I have bookmarked it in my google bookmarks.
I was wondering if you ever thought of changing the structure of your website? Its very well written; I love what youve got to say. But maybe you could a little more in the way of content so people could connect with it better. Youve got an awful lot of text for only having one or 2 images. Maybe you could space it out better?
Your point of view caught my eye and was very interesting. Thanks. I have a question for you. https://accounts.binance.com/cs/register?ref=PORL8W0Z
Thank you, your article surprised me, there is such an excellent point of view. Thank you for sharing, I learned a lot.
Good post. I be taught one thing more challenging on different blogs everyday. It can at all times be stimulating to learn content from other writers and practice a bit of something from their store. I’d favor to use some with the content material on my weblog whether you don’t mind. Natually I’ll give you a hyperlink in your web blog. Thanks for sharing.
I enjoy looking through and I think this website got some really useful stuff on it! .
I am curious to find out what blog platform you’re utilizing? I’m experiencing some minor security problems with my latest blog and I would like to find something more secure. Do you have any suggestions?
This web site is really a walk-through for all of the info you wanted about this and didn’t know who to ask. Glimpse here, and you’ll definitely discover it.
Hey there would you mind sharing which blog platform you’re working with? I’m planning to start my own blog in the near future but I’m having a hard time selecting between BlogEngine/Wordpress/B2evolution and Drupal. The reason I ask is because your layout seems different then most blogs and I’m looking for something unique. P.S Sorry for getting off-topic but I had to ask!
Hi there, I discovered your site by the use of Google whilst searching for a comparable subject, your website got here up, it seems to be great. I have bookmarked it in my google bookmarks.
I got what you mean , thankyou for putting up.Woh I am lucky to find this website through google. “The test and use of a man’s education is that he finds pleasure in the exercise of his mind.” by Carl Barzun.
Thanks Matt this is awesome!!
Hello Matt,
I was just tring to do sth new and found your blog. It solves many practical issues.
After creating the column or measure sub-folders, if I create any Column or measure that doesn’t comes under the sub-folders. Can you please help me with this.
correct. Any new columns and measures wont go automatically into the sub folders. That is why the column subfolder is better – because you shouldn’t be creating too many columns (read this https://exceleratorbi.com.au/calculated-columns-vs-measures-dax/)
so go back into the model view and move the new item into the sub folder by typing the name of the subfolder
I can no longer move my REPORT LEVEL Measures between tables inside a Live Connection. I believe this all came about when Power BI updated all the options being discussed above.
Import mode has more options to move and group your Measures. But Report Level Measures. I’m stuck at the moment. If I want to move them, I have to delete them and re create them inside the table I want them to be in.
Has anybody else had this experience, and know a workaround?
I just tested it with the May 2019 version, and it works for me. Drag and drop measures works in the Model view, and also I can select a measure in the report view, click modelling and change the home table
I don’t understand how you can get to the model view with a live connection? Are you understanding that I am asking about Report Level Measures when you have a live connection to the Power BI service? Not regular measures.
Sorry, I thought you were using direct query, but it seems like you are using SSAS.
My first thought was that this was brilliant. But then I realized that in the example above (looking at the sales/fact table), the none-fact columns should have been hidden anyway, and you do want to mix the remaining fact column (if not replaced with explicit measures) with the measures to get a good overview. So if we hide what should be hidden and make sure to not enable “view hidden”, all the benefits kind of goes away. Although, having said this, it’s still something appealing with your suggestion Matt
My first thought was that this was brilliant. But then I realized that in the example above (looking at the sales/fact table), the none-fact columns should have been hidden anyway, and you do want to mix the remaining fact column (if not replaced with explicit measures) with the measures to get a good overview. So if we hide what should be hidden and make sure to not enable “view hidden”, all the benefits kind of goes away. Although, having said this, it’s still something appealing with your suggestion Matt
Very nice. It would be even nicer if Microsoft provided a way to put all measures in a folder as well. Then we would have a folder for columns and one for measures. And we wouldn’t need to preface the Columns folder with an underscore.
Very nice. It would be even nicer if Microsoft provided a way to put all measures in a folder as well. Then we would have a folder for columns and one for measures. And we wouldn’t need to preface the Columns folder with an underscore.
Fantastic, Matt! I put this in place today
Fantastic, Matt! I put this in place today
Thanks Matt.
What a real time saver. This makes it a lot easier for me to see and find out what I want without having to scroll down and up looking for the measure I need.
Thanks Matt.
What a real time saver. This makes it a lot easier for me to see and find out what I want without having to scroll down and up looking for the measure I need.
Thanks Matt
I appreciate the share of knowledge – it really helps & works well.
cheers
Thanks Matt
I appreciate the share of knowledge – it really helps & works well.
cheers
I like it! What happens when you add an extra column sometime in the future? Do you just have to manually add it then to the sub folder
You are right Nathan. New columns need to be added to the folder, but new columns are not as common as new measures, particularly if you avoid writing calculate columns where possible (as I always advise)
As I have learnt, there are many ways to skin a cat. But this is by far, the best way to do so. Thanks.
I agree Jeffrey. It’s just amazing that I didn’t think of it before, nor did I see it suggested by others.
As I have learnt, there are many ways to skin a cat. But this is by far, the best way to do so. Thanks.
I agree Jeffrey. It’s just amazing that I didn’t think of it before, nor did I see it suggested by others.
I’ve been searching for the best solution for storing measures since I started using Power BI 2 years ago.
Until Microsoft allow us to create a ‘logical’ model which doesn’t break things like Q&A, this is by far my favorite approach. Great work Matt – thanks!
I’ve been searching for the best solution for storing measures since I started using Power BI 2 years ago.
Until Microsoft allow us to create a ‘logical’ model which doesn’t break things like Q&A, this is by far my favorite approach. Great work Matt – thanks!
Yes! This is a neater approach. Thanks for that!
Yes! This is a neater approach. Thanks for that!
Thank Matt. This was just in time information. I was just thinking about a way to do this when your email arrived. Perfect
Thank Matt. This was just in time information. I was just thinking about a way to do this when your email arrived. Perfect