I have been increasingly recording videos as my method of sharing tips and techniques for getting more out of Power BI. Some concepts are best documented (traditional blogging) and some are just easier for everyone if it is a video. That is the case again for today.
Compare Any Two of Anything in Power BI
The whole concept here is to allow a user to pick two things from a list and compare them with each other. For example, compare
- Any year with any other year
- Any product against any other product (maybe even a group of products, using multi select)
- Snapshots (eg different versions of a financial forecast) with any other version
- Etc
What is possible is endless, and the good news is that it is pretty simple to do this in Power BI. Check out my video below to see how I did it.
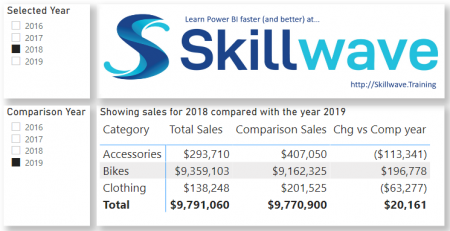
Final Result
You can see in the image below, the user can select a year from the top slicer and any other year from the bottom slicer, and the visual updates along with the title of the visual clearly communicating what is being displayed.
If you would like to learn more about Power BI from experts like me, Ken Puls, Miguel Escobar, and Reid Havens (all Microsoft MVPs), head over to http://skillwave.training and check out our training course catalogue. Yes, you can learn yourself using YouTube – there is a lot of great free content out there (like my video below), but you will learn better/faster if you take a structured course built by industry professionals.
Thanks for sharing. I read many of your blog posts, cool, your blog is very good.
Can you be more specific about the content of your article? After reading it, I still have some doubts. Hope you can help me.
This technique looks easy but when I tried it on my data set it doesn’t work. I have a table for survey data and then I copied it to have “comparison table”. I want to compare data per event name/event date. I made a measure for “comparison number of respondents. I tried to use it to compare number of respondents per gender to test it, but it shows the total for the event name/event date from the comparison table.
Gender | Count Response ID(Event 1) | Comparison Count Response ID (Event 2)
Male | 2206 | 1977
Female | 2996 | 1977
The example I provided does not duplicate the data, it duplicates the dimension table. https://exceleratorbi.com.au/the-optimal-shape-for-power-pivot-data/
Hey, I got it! All I need to do was to create a dimension table / look up table.
Thank you very much!
Please Help, the filter doesn´t work with me, the formula it’s not being useful. I’ve tried everything. I don´t know if I’m making a mistake
You have not provided any information to help me understand the problem, so I don’t know how I can help. I can tell you that the Information provided does work. I suggest you work your way through the instructions again and check every step. There is something you have not done as prescribed; you just have to find it and fix it, then it will work.
Is it possible to compare “text” between multiple projects using slicers?
Suppose I have three projects named “A1”, “B2′ and “C3” respectively and I want to show the names that are not present in both of these projects. Like for example
project_id | task_code | activity
A1 R214 Paving
A1 C321 Widening
A1 T223 Cleaning
B2 R214 Paving
B2 E343 Keeping
B2 T223 Cleaning
C3 D431 Pathing
C3 E343 Keeping
C3 O928 Equalizing
See if this article helps
https://exceleratorbi.com.au/items-not-selected-slicer/
It might not be exact, but may help
Very nice example, very useful and a good way to learn for newer user.
Hello Matt, Do you know if the same thing is possible with just a single slicer?
What is the use case? This article shows how to compare 2 items from 2 different slicers. If you only had 1 slicer, what would you be comparing with?
Dear Matt,
great explanation, this helps me an important step further.
However, I do question:
in your example, each collumn in the matrix is corresponding with one filter (year).
However, how to deal with each collumn in the matrix has to respond to two filters (let say: year and category)?
Thanks in advance for your insights!
create additional disconnected slicer(s) for category, and then hard code these into the CALCULATE function, just like the Year slicers
Great video thanks
Hi Matt. Great video. Simple and works! A follow up question if possible…
If we select multiple months to compare, say 3 months, the matrix correctly displays the 3 individual month sales, but the comparison sales is the sum of all 3 months selected in the comparison date slicer, not comparing each month selected to it’s counterpart.
To simplify the problem, rather than dynamically identifying which of the columns selected to be compared against, if we hard coded the comparison feature, say, wanting to compare sales from July from the current year with July from the previous year, would this DAX be easier to code for the Comparison Sales column?
Thanks in advance and happy to chat offline.
There are many different ways to solve such problems. This approach is how to do it dynamically comparing 1 item with another. I see no reason why you couldn’t use this technique using months and have those months combine to compare “these 3” with “those 3”. Or you can hard code it – it’s just it is not dynamic then.
Great demo! And could help me to get nearer to my search for the explicit definition of the implicit measure Difference to.. which come for free with each pivot table in Excel. I read every now and then that implicit measures are under the hood “just” DAX-formulas…but I have never seen so far a 1:1 translation. This technique seems to do the trick…for every filter on your data define an inactive comparison filter… and I guess you can even calculate differences for multiple filters, i.e. (year, product) vs (comparison year, comparison product) etc. Would you by chance happen to know any documentation, link on the DAX code used for implicit measures ?
I’ve looked and never found any. I have actually spoken to MS about this, Will Thompson and Kasper de Jonge, from memory. There is a technical difference to the way Power Pivot handles this, and the way it is done in PBI. In Power Pivot, there is actually a measure generated and stored in the Power Pivot model (implicit measure). If you do this in PP, then migrate the model to PBI, you can actually see the implicit measure, DAX and all. PBI handles it differently, more like a regular pivot table (without Power Pivot). The software has a set of standard functions (sum, count, min, max, etc) that it allows the user to apply to a column when used in a visual (in some locations). There is no actual measure generated, but the use of the Columns in this way causes the tool (PBI) to generate the aggregations automatically under the hood. The difference is transparent to the user, but technically there is no implicit measure in PBI, but there is in Power Pivot. So the official line I was told by MS is there are no implicit measures in PBI, just implicit calculations. Now, having said that, I believe it is useful to refer to implicit measures, as everyone seems to use that term.
When you write a measure, you are writing some DAX code which is sent to a pre-compiling engine before being sent to the formula engine and storage engine for processing. When you add a column into a values well in PBI, the UI understands what you want (sum is default, but it can be changed). Instead of writing A measure, the UI sends the request straight to the compiler and the same process is executed. If you want to sum a column, or write DAX for SUM(table[column]), what is sent by the complainer is identical.
Hope that helps.
Thnx for the swift and comprehensive answer and nice to read you have looked for this yourself 🙂
I will have a look into your suggestion to migrate the PP model to PBI as that might shed some more light on this illustrious issue. Best, HJ
Wonderful :). Then the next question is… how to filter comparison slicer so it doesn’t show selected items from non-comparison slicer?
good question. I think I will record a follow up video to reply to this. Watch out in the next 24 hours or so for a new blog post.
Very concise and clear explanation.
Sometimes we come across people who clearly know a lot about a certain subject but cannot explain it in a simple way, which is not the case with Matt Allington.
Thank you.
JM
You made it look so easy! Thanks for that
On a side note, your Power BI runs really smoothly. I find mine can be really choppy and lags a lot. I experience this on both my work and personal machine, each with 8GB ram. Is that insufficient for Power BI ?
Sometimes I edit out the spinning wheel so you don’t have to wait for Power BI to update. 8GB is the minimum and should be fine unless you have 10’s of millions of rows of data.
This is so elegant – thank you
Very nice, Matt. Thanks
Hey Matt, some of us poor souls have an IT department that restricts access to YouTube etc. …any chance you could provide both the video and a more traditional blog for your solutions?
Hey Mat. I sympathise for you. Companies that don’t allow access to YouTube are dinosaurs. I say companies and not IT, because the IT department is only as good as the leadership of the company. Read my article about that here https://p3adaptive.com/2016/10/company-suffer-battered-syndrome/
While I would like to help, it takes 2-4 hours to produce either a video or a blog, and I don’t have the extra time to do both. Time for you to start lobbying your company for a more progressive approach to IT 🙁
Great tip Matt, simple, smart but terribly useful. Thanks!