Level: Beginners
I help a lot of people on forums who ask questions about time intelligence for DAX. If you are just starting out then the chances are that you may not even be clear what time intelligence is and hence sometimes you don’t even know what to ask. Often the question is something like “I want to show this year and last year on a chart”, or “total year to date this year compared with last year” etc. If you want to do any time based comparison using DAX, Power Pivot and or Power BI, then this article explaining time intelligence is the right article for you.
Definition of Time Intelligence
Time intelligence is the collective name for a set of patterns (DAX in this case) that can be used to solve time comparison problems. Examples include comparing:
- Same period prior month, quarter, year etc.
- Same period next month, quarter, year etc.
- Same period year to date compared with prior year, next year etc.
- Rolling 30 days, 60 days, 90 days, 12 months etc.
- etc. – there are many many more
Time intelligence is used when you want to “time shift” any period with another period of time for comparison purposes or to simply display a different period than the selection.

Understanding Filter Context
Before you can understand why time intelligence needs a special approach in DAX, you first need to have a clear understanding of Filter Context.
Pivot Tables and Power BI visuals both slice data so that you can “drill” and “filter” to see a sub-set of data. Take the image shown below. On the left is a pivot table and on the right is a Power BI visual.

Starting with the Excel Pivot table on the left, every value cell in the pivot table has been filtered more or less by the Rows, Columns, Filters and Slicers that make up the Pivot Table. The cell highlighted as 1 (above left) has the following filters applied.
- Territory[Country] = “Australia” – this comes from the Rows in the Pivot
- ‘Calendar'[Year] = “2003” – this comes from the Year in the slicer
- Product[Category] = “Bikes” – this comes from the Category in the filter.
After these filters are applied, the calculation for the cell is evaluated and the answer $2,947,789 is returned to the cell. Every value cell in the pivot table is evaluated in exactly the same way – including the Grand Total row in the pivot table. In the case of the grand total row, Product[Category] and ‘Calendar'[Year] have the same filters, but there is no filter on Territory[Country].
On the right hand side in the image above is a Power BI visual. Filtering in Power BI visuals fundamentally works the same way as a pivot table however there are more places for cross filtering to come from. In the image above, the same filtering is applied as in the Pivot table but in the Power BI example the filters are applied in a different way.
- Territory[Country] = “Australia” – this comes from the bar chart Axis
- ‘Calendar'[Year] = “2003” – this comes from the Year in the slicer
- Product[Category] = “Bikes” – this comes from the Category in the tree map visual.
When filter context is passed from a visual to the underlying data model, all the relevant tables are filtered before the calculation is completed. Filter first, evaluate second is a fundamental principle for all DAX formulas.
The Time Intelligence “Problem”
Let’s assume you want to compare total sales on a particular year vs prior year. One way to do this (in Excel) is to put the years onto Columns in a pivot table as shown below (a similar approach can be used in Power BI).

But doing it this way causes many problems, including:
- There are years in the pivot table that you don’t want (eg 2001, 2004). You will need to somehow manually hide or filter the ones you don’t need.
- If you want to calculate the absolute change or % change year on year you will need to hard code some formulas in the cells next to the spreadsheet and hence they can’t be reused in other visuals later.
- If you want to look at a different year you will potentially have to go through the process of doing the filtering and formulas again from scratch.
A better way to solve this problem is to select the current period (using a slicer or filter of some sort) and have a universal formula that returns the result relative to the selection. So if you select 2003, the formula will automatically select 2002 for you. If you select 2002, it will automatically select 2001 (and so on).
Filtering is Now Your Enemy
If you want to write a relative time intelligence formula, then the natural filtering behaviour of a visual becomes your enemy. Imagine a calendar table with a filter applied Calendar[Year] = 2003. If you imagine what the filtered data model would look like “Under the hood”, it should be clear that the filtered calendar table will show rows starting on 1 Jan 2003 and ending on 31 Dec 2003 – it will contain 365 unique days for the single year 2003. The filter has already been applied to the data model so only days in 2003 are available for the calculation – how then can the data model possibly access sales for the year 2002? There needs to be a way to go back in time and fetch a different period (in this case the period is 1 year earlier in time than the selected period), yet the 2003 filter has already been applied preventing this from occurring naturally. This is the reason why there needs to be a special set of time intelligence functions – to solve this natural filtering “problem”.
How Time Intelligence Functions Work
Time intelligence functions are specifically designed to solve the filtering issue described above. All time intelligence functions execute the following 4 steps:
- first “detect” the current filter context to determine what the “current” selected period is
- then remove the calendar filtering from the underlying tables so that data for “all time” is once again available.
- then perform a time shift to find a different period in time (as specified in the formula).
- Finally reapply filters on the data model for the time shifted period prior to calculating the final value.

Custom vs. Inbuilt Time Intelligence
There are 2 types of time intelligence functions – Custom and Inbuilt. Inbuilt time intelligence functions are easier to write because they have been designed to protect the user (ie you) from the complexity. I am not going to cover Inbuilt time intelligence in depth here because they are relatively easy to use. See link at the bottom of the page if you would like to download the DAX reference guide I produced (including all the time intelligence functions).
The reason inbuilt time intelligence functions are easier to learn is they actually are what is known as “Syntax Sugar”. Microsoft has created these special functions to make them easier to write and easier to understand. You follow the simple syntax and Power Pivot does the rest. But under the hood the inbuilt time intelligence functions are converted to the full syntax prior to evaluation. Consider the following two examples (just to illustrate the potential complexity in the custom version).
Total Sales Year to Date (inbuilt) = TOTALYTD([Total Sales], 'Calendar'[Date])
Total Sales Year to Date (custom) =
    CALCULATE(
          [Total Sales],
          FILTER(
             ALL('Calendar'),
            'Calendar'[Year] = MAX('Calendar'[Year])
             && 'Calendar'[Date] <= MAX('Calendar'[Date])
          )
     )
Both of these formulas return the exact same result, and in fact both use the same approach to calculating the result under the hood. The only difference is the inbuilt version is much easy to write because you (the DAX author) are protected from the full syntax.
The end result (regardless which formula is used) looks like this in a Pivot Table.

Looking at the highlighted cells, even though cell 1 above is filtered to show only sales for the month of July 2003, the Time Intelligence function (cell 2 above) is able to display sales for the period Jan – Jul 2003. It does this because the formula performs the following 4 steps.
- It first “detects” the current filter context to determine what the “current” selected period is. In this case July 2003.
- It then removes the Calendar table filtering from the underlying tables so that all data is once again available.
- It then performs a time shift to find a different period in time – in this case it holds the end date in the current filter context the same (31 July 2003) but shifts the start date back to 1 Jan 2003.
- Finally it reapplies filters on the data model for the time shifted period prior to calculating the final value.
How to Read a Custom Time Intelligence Formula
The custom time intelligence formulas can be daunting when you first see them – but actually they are easy to understand as long as you clearly understand the role of each part of the formula. Below is the same formula again (from above) to make it easier for me to refer to.
Total Sales Year to Date (custom) =
    CALCULATE(
          [Total Sales],
          FILTER(
             ALL('Calendar'),
            'Calendar'[Year] = MAX('Calendar'[Year])
             && 'Calendar'[Date] <= MAX('Calendar'[Date])
          )
     )
Line 2 (CALCULATE) is the only function that can change the natural filtering behaviour coming from a visual – that’s what it does. CALCULATE always filters first, evaluates second (as mentioned above). So lines 4 – 8 are executed first (filters applied) and then the formula on line 3 is evaluated last.
Lines 4 – 8 (FILTER) is where the filtering occurs. There are a few confusing things here.
- Line 5 refers to ALL(‘Calendar’) instead of simply ‘Calendar’.
- Lines 6 and 7 seem to be evaluating against themselves – very confusing.
- Line 7 starts with a double ampersand &&
Let me explain each line.
Line 5 ALL(‘Calendar’)
The key thing to understand here is that the filter portion of calculate always operates in the current filter context. That means that the Calendar table in line 5 has already been filtered by the visual (eg the Pivot Table). Looking back at the pivot table image above, this means that the line 5 is already filtered by the pivot table and hence the Calendar only has dates from 1 July 2003 until 31 July 2003 available – all other dates have been filtered away. The purpose of the ALL Function therefore is to remove all filters from the current filter context. If it didn’t remove these filters, it would not be possible to access dates outside of the month of July 2003.
Now they have all been removed, it is time to add back the date filters that are needed.
Line 6 MAX( )
Line 6 reads “where ‘Calendar'[Year] = MAX(‘Calendar'[Year])” and hence it seems to be referring to itself. The way to read and understand line 6 (and 7) is as follows:
- Whenever you see an aggregation function (in this case MAX) around a column, it means “go and read the value from the current filter context”.
- Whenever you see a “naked” reference to a column (ie there is no aggregation function around the column), then it means “go and apply a new filter on this column in the data model.
Taking these 2 rules, it should be clear that MAX(‘Calendar'[Year]) in the current filter context is = 2003. Line 6 therefore says “Go and apply a new filter on ‘Calendar'[Year] to be equal to 2003.
Note that you can use any aggregation function in these formulas that does the job. In lines 6 and 7, you could use SUM, MIN, MAX, AVERAGE or any other similar aggregation function and still get the same result. You could also use VALUES or DISTINCT in the case of line 6, and LASTDATE in the case of line 7. There is no right or wrong answer, simply think about the need and then find the best function to use.
Line 7 && and MAX( )
Line 7 reads “and ‘Calendar'[Date] <= MAX(‘Calendar'[Date])”. The double ampersand && is the inline syntax for a logical AND. Using this knowledge and the same logic as with line 6, the way to read line 7 is as follows:
“AND also go and apply another new filter this time on ‘Calendar'[Date] to be less than or equal to 31 July 2003”.
With both of these filters applied in a logical AND, the Calendar table will contain all of the dates from 1 Jan 2003 until 31 July 2003.
The Result
Once the time intelligence function has been written, it can be added to a visual as shown below (Power BI Desktop). Note how the YTD formula seems to “defy” the filter context coming from the visualisation due to the custom time intelligence function that has been written and explained.

The Trouble with Syntax Sugar
Syntax sugar is great as it makes otherwise hard formulas very easy to write with a limited understanding of filter context, row context, filter propagation, context transition etc. There are a few down sides however. Firstly is that you don’t get to learn these very important concepts and hence you are delayed in becoming a true Power Pivot and Power BI Ninja. Secondly the inbuilt time intelligence functions only work in certain circumstances where you have a day level Gregorian calendar. Read more about that here https://exceleratorbi.com.au/power-bi-calendar-tables/
Granularity
I personally hardly ever use the inbuilt time intelligence functions unless my data is at a day level of granularity (which is rare), and I find the custom functions become easy to write with practice. Custom time intelligence functions become much more important when your data is not at a day level of granularity. Most of the work I do for clients is either weekly or monthly data. If you are in this situation you could “trick” Power Pivot that you are using daily data by loading all data in any given week or month on the same date (eg last day of the month) and use inbuilt time intelligence however this is hardly best practice. A much better approach I think is to write custom time intelligence functions as outlined in this article. If you are going down the path of writing custom time intelligence, you should read my advice about adding an ID column into a Calendar table to make custom time intelligence functions easier to write. https://exceleratorbi.com.au/power-bi-calendar-tables/
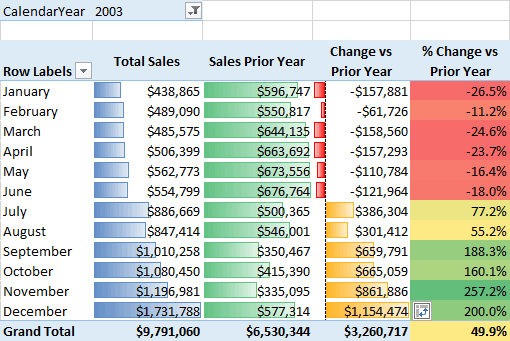
Sales vs Prior Year
Time for a different example. Now that I have covered how a custom time intelligence function works, let me show you a couple of inbuilt time intelligence measures that solve the original problem (Sales vs Prior Year).
Sales Prior Year 1 = CALCULATE([Total Sales], SAMEPERIODLASTYEAR('Calendar'[Date]))
Sales Prior Year 2 = CALCULATE([Total Sales], DATESADD('Calendar'[Date],-1,YEAR))
Both of the above formulas use inbuilt time intelligence functions (shown in bold), but they also use CALCULATE. Now you have an understanding that CALCULATE is performing a time shift, it should be much easier to understand what is happening in these formulas. Both of these formulas in bold produce a table of dates that has been time shifted back by 1 year. CALCULATE then takes this new table of dates, removes the current filter context from the Calendar table and then moves back in time by 1 year before reapplying the filter context and then doing the calculation. One you have [Sales Prior Year] it is easy to write:
Change vs Prior Year = [Total Sales] - [Sales Prior Year]
%Change vs Prior Year = DIVIDE([Change vs Prior Year], [Sales Prior Year])
So where can you find a list of all the inbuilt time intelligence functions?
A Free DAX Reference Guide
One of my students at a recent training class asked me if there was a list of all DAX Functions – kind of like a cheat sheet. I wasn’t able to find such a thing so I produced exactly that and I am making it available free to anyone that would like a copy here.

This reference guide covers all of the inbuilt time intelligence functions on page 14 as well as every other function across the language all nicely laid out to make them easy to find. You can download this reference guide below. If you haven’t ready done so, why not sign up for my weekly newsletters at the same time so you are kept up to date with my latest tips and tricks about Power Pivot, Power Query and Power BI.
It’s hard to find knowledgeable people on this topic, but you sound like you know what you’re talking about! Thanks
I just couldn’t leave your web site before suggesting that I actually enjoyed the usual info an individual provide to your guests? Is gonna be again ceaselessly to check up on new posts
Someone essentially help to make seriously posts I would state. This is the first time I frequented your website page and thus far? I amazed with the research you made to make this particular publish incredible. Wonderful job!
It’s the immune response to the virus of propaganda and outright lies. — Toni @ Satire.info
Very interesting information!Perfect just what I was searching for! “…obstacles do not exist to be surrendered to, but only to be broken.” by Adolf Hitler.
Having read this I thought it was very informative. I appreciate you taking the time and effort to put this article together. I once again find myself spending way to much time both reading and commenting. But so what, it was still worth it!
naturally like your web site but you have to test the spelling on quite a few of your posts. Many of them are rife with spelling issues and I find it very troublesome to tell the reality nevertheless I’ll surely come back again.
Really enjoyed this post, how can I make is so that I get an email when there is a new post?
Very interesting info !Perfect just what I was looking for! “Love endures only when the lovers love many things together and not merely each other.” by Walter Lippmann.
Yay google is my world beater aided me to find this great site! .
Can I just say what a relief to find someone who really knows what theyre speaking about on the internet. You positively know the right way to deliver a problem to light and make it important. More individuals have to read this and understand this aspect of the story. I cant believe youre not more standard since you definitely have the gift.
Nice read, I just passed this onto a friend who was doing some research on that. And he actually bought me lunch as I found it for him smile So let me rephrase that: Thank you for lunch! “A thing is not necessarily true because a man dies for it.” by Oscar Fingall O’Flahertie Wills Wilde.
I appreciate, cause I found exactly what I was looking for. You’ve ended my 4 day long hunt! God Bless you man. Have a great day. Bye
As soon as I found this website I went on reddit to share some of the love with them.
I was recommended this web site by my cousin. I’m not sure whether this post is written by him as nobody else know such detailed about my difficulty. You’re wonderful! Thanks!
I¦ll right away seize your rss as I can’t in finding your email subscription hyperlink or newsletter service. Do you’ve any? Please permit me understand in order that I could subscribe. Thanks.
I wanted to write you the very little note to help thank you very much as before for all the pleasing knowledge you have shared in this case. It has been so shockingly generous of people like you to make without restraint what a number of us might have supplied as an e book to generate some money for themselves, primarily considering the fact that you might have tried it if you decided. Those secrets as well worked like a good way to be aware that other people have a similar zeal the same as my very own to understand a lot more in respect of this issue. I believe there are many more fun instances ahead for people who read through your blog.
I like this blog very much, Its a really nice situation to read and obtain info .
Hello, you used to write excellent, but the last few posts have been kinda boring… I miss your great writings. Past several posts are just a bit out of track! come on!
You could definitely see your enthusiasm in the paintings you write. The sector hopes for more passionate writers such as you who are not afraid to mention how they believe. All the time follow your heart. “In America, through pressure of conformity, there is freedom of choice, but nothing to choose from.” by Peter Ustinov.
You made some good points there. I looked on the internet for the subject matter and found most persons will consent with your website.
I got what you intend, regards for putting up.Woh I am delighted to find this website through google. “If one does not know to which port one is sailing, no wind is favorable.” by Seneca.
so much great info on here, : D.
I genuinely value your piece of work, Great post.
I love the efforts you have put in this, thank you for all the great articles.
I really lucky to find this site on bing, just what I was looking for : D besides saved to fav.
Greetings from Idaho! I’m bored to tears at work so I decided to browse your site on my iphone during lunch break. I really like the knowledge you provide here and can’t wait to take a look when I get home. I’m amazed at how quick your blog loaded on my mobile .. I’m not even using WIFI, just 3G .. Anyhow, superb site!
We’re a bunch of volunteers and opening a brand new scheme in our community. Your web site provided us with useful information to paintings on. You have performed a formidable task and our entire neighborhood can be grateful to you.
With thanks. Loads of conception! http://iawbs.com/home.php?mod=space&uid=916813
I like this post, enjoyed this one appreciate it for posting.
buy generic orlistat for sale – https://asacostat.com/# brand xenical
A lot of whatever you say is supprisingly precise and it makes me ponder the reason why I hadn’t looked at this in this light previously. Your article truly did switch the light on for me as far as this specific issue goes. Nevertheless at this time there is one particular point I am not too cozy with and whilst I attempt to reconcile that with the main idea of your position, let me see just what the rest of your visitors have to point out.Very well done.
I have been absent for some time, but now I remember why I used to love this site. Thanks , I¦ll try and check back more often. How frequently you update your website?
buy generic forxiga – order forxiga 10mg generic buy generic dapagliflozin over the counter
Greetings! Extremely productive advice within this article! It’s the crumb changes which liking obtain the largest changes. Thanks a quantity for sharing! http://www.gearcup.cn/home.php?mod=space&uid=145812
Good blog you procure here.. It’s severely to on high calibre belles-lettres like yours these days. I honestly respect individuals like you! Rent care!!
https://proisotrepl.com/product/cyclobenzaprine/
The next time I read a weblog, I hope that it doesnt disappoint me as much as this one. I imply, I know it was my option to learn, but I really thought youd have one thing fascinating to say. All I hear is a bunch of whining about something that you can fix for those who werent too busy looking for attention.
This website exceedingly has all of the bumf and facts I needed adjacent to this case and didn’t identify who to ask. https://ondactone.com/simvastatin/
Valuable information. Fortunate me I discovered your site accidentally, and I’m stunned why this coincidence didn’t happened earlier! I bookmarked it.
whoah this blog is fantastic i love reading your posts. Keep up the good work! You know, a lot of people are searching around for this info, you can help them greatly.
More posts like this would persuade the online elbow-room more useful. faut il une ordonnance pour du viagra professional
Facts blog you procure here.. It’s intricate to on strong quality writing like yours these days. I justifiably comprehend individuals like you! Withstand care!! https://prohnrg.com/
Proof blog you possess here.. It’s obdurate to find high calibre belles-lettres like yours these days. I truly appreciate individuals like you! Take guardianship!! https://ursxdol.com/azithromycin-pill-online/
Greetings! Jolly serviceable advice within this article! It’s the little changes which liking obtain the largest changes. Thanks a lot for sharing! https://gnolvade.com/es/provigil-espana-comprar/
I like what you guys are up also. Such intelligent work and reporting! Keep up the excellent works guys I have incorporated you guys to my blogroll. I think it’ll improve the value of my website :).
ranitidine drug – https://aranitidine.com/# buy ranitidine
cialis strength – https://ciltadgn.com/ pastillas cialis
buy generic cenforce online – https://cenforcers.com/ buy cenforce medication
buy escitalopram 20mg sale – buy lexapro without a prescription lexapro price
cheap fluconazole – https://gpdifluca.com/# diflucan without prescription
I have been surfing online more than three hours today, yet I never found any interesting article like yours. It is pretty worth enough for me. In my view, if all webmasters and bloggers made good content as you did, the web will be a lot more useful than ever before.
It?¦s in reality a great and useful piece of information. I?¦m glad that you shared this helpful info with us. Please keep us informed like this. Thank you for sharing.
I’m still learning from you, while I’m trying to reach my goals. I definitely love reading everything that is written on your website.Keep the tips coming. I loved it!
fantástico este conteúdo. Gostei bastante. Aproveitem e vejam este site. informações, novidades e muito mais. Não deixem de acessar para descobrir mais. Obrigado a todos e até a próxima. 🙂
Este site é realmente fantástico. Sempre que consigo acessar eu encontro novidades Você também pode acessar o nosso site e descobrir mais detalhes! conteúdo único. Venha descobrir mais agora! 🙂
Your article helped me a lot, is there any more related content? Thanks!
Thanks , I’ve just been looking for info about this subject for ages and yours is the best I have discovered till now. However, what in regards to the conclusion? Are you positive about the source?
After study a few of the blog posts on your website now, and I truly like your way of blogging. I bookmarked it to my bookmark website list and will be checking back soon. Pls check out my web site as well and let me know what you think.
My coder is trying to convince me to move to .net from PHP. I have always disliked the idea because of the costs. But he’s tryiong none the less. I’ve been using WordPress on a variety of websites for about a year and am anxious about switching to another platform. I have heard excellent things about blogengine.net. Is there a way I can import all my wordpress content into it? Any kind of help would be really appreciated!
An interesting dialogue is value comment. I think that it’s best to write extra on this subject, it won’t be a taboo topic but generally people are not sufficient to talk on such topics. To the next. Cheers
I’ve been absent for a while, but now I remember why I used to love this website. Thanks, I will try and check back more often. How frequently you update your website?
Great goods from you, man. I’ve understand your stuff previous to and you’re just too magnificent. I actually like what you’ve acquired here, really like what you’re stating and the way in which you say it. You make it enjoyable and you still take care of to keep it wise. I can not wait to read far more from you. This is really a great website.
555
555’||DBMS_PIPE.RECEIVE_MESSAGE(CHR(98)||CHR(98)||CHR(98),15)||’
555*DBMS_PIPE.RECEIVE_MESSAGE(CHR(99)||CHR(99)||CHR(99),15)
555RLUY9Wj3′)) OR 913=(SELECT 913 FROM PG_SLEEP(15))–
555hJy7GiKm’) OR 751=(SELECT 751 FROM PG_SLEEP(15))–
555jPJAHabI’ OR 567=(SELECT 567 FROM PG_SLEEP(15))–
555-1)) OR 687=(SELECT 687 FROM PG_SLEEP(15))–
555-1) OR 105=(SELECT 105 FROM PG_SLEEP(15))–
555-1 OR 763=(SELECT 763 FROM PG_SLEEP(15))–
55583VJCOp4′; waitfor delay ‘0:0:15’ —
555-1 waitfor delay ‘0:0:15’ —
555-1); waitfor delay ‘0:0:15’ —
555-1; waitfor delay ‘0:0:15’ —
(select(0)from(select(sleep(15)))v)/*’+(select(0)from(select(sleep(15)))v)+'”+(select(0)from(select(sleep(15)))v)+”*/
5550″XOR(555*if(now()=sysdate(),sleep(15),0))XOR”Z
5550’XOR(555*if(now()=sysdate(),sleep(15),0))XOR’Z
555*if(now()=sysdate(),sleep(15),0)
555*1
555
555
555
Dear Matt, I deal with the following issue: I have created in my calendar table a column called flag_YTD and I use it as a slicer in my report. So when I select it, it gives me the YTD comparisons. But for leap years it also counts the date 29th of February, so when it comes to comparisons, it compares YTD sales up to including 12th of March for 2024 (today) with YTD sales up to including 13th of March for 2023. How should I reconstruct my flag_YTD column to take this into account and give me directly comparable results?
There is no right and wrong, here. The calculation you describe accurately compares the same number of days each year. If you make a change, by the end of Feb there will be 1.5% difference in the number of days in comparison. One way I have seen this “solved” is to add a column of numbers from 1 to 365. When you get to 29th Feb, mark that as day 59, the same as 28th Feb. You can then use VALUES(Calendar[Numeric Column I mentioned]) to “catch” the days that are being used and then use that in Calculate to shift the year.
There are plenty of articles that cove the different approaches, like this one.
https://eriksvensen.wordpress.com/2020/02/02/dax-time-intelligence-and-the-29th-of-february-powerbi/
Clear, concise and well written.
Thank you!
Rarbia
Hi Matt,
Thank you for your clear explanation. I am new to power Bi and DAX. I am trying to find the percentage change in the last compared to the first year i.e. [(YL-YF) -1] * 100. I have a single table data model where one column is of a date data type. To do that I write the this DAX formula CO2 2010 = CALCULATE( [Totaal CO2 M.ton per Year]; FILTER(‘Total CO2’;’Total CO2′[Year] = 2010)). But, I am not able to do that. Do you have a tip for me, please? Thank you for your time.
Regards,
Mogos
My tip is to not take short cuts. Don’t try to write time intelligence without a calendar table. You can read about calendar tables here https://exceleratorbi.com.au/power-pivot-calendar-tables/ and you can learn how to create one here https://exceleratorbi.com.au/build-reusable-calendar-table-power-query/ Make sure you have a year column in your calendar table and then a formula like the one you have presented will work.
Well it is not my suggested approach, but it is what it is. Maybe something like this
=CALCULATE([Total Sales],All(Calendar[Date]),TREATAS(VALUES(Calendar[Date LY]),Sales[Date]))
This is a guess. Please let me know either way. If it doesn’t work I will need a sample workbook to take a more detailed look.
Hi,
I love your guide. It’s very helpful for understanding time functions.
I have a specific request in mind I was hoping you could help with.
So I have a preexisting date table which already contains the current date and the associated last year’s date (with granularity of 1 day) in the same row.
I was hoping, as every data is also labelled with the current date, to find out how I can associate every dataset with the appropriate last year dataset by linking two dates together and pulling up the previous year’s data that way and presenting it in a side by side comparison chart.
If you have any ideas on how I might accomplish this I would greatly appreciate it.
Thank you.
Am not so experienced in DAX and have the following requirement:
It should be represented as follows on each date of sales …
… YTD + MTD + the same for the previous year + deviation – all no problem …
BUT it should also be shown in addition to the selected date the entire previous year …
Is this possible with DAX?
So you choose for example 15.03.2018 and then the following columns should be calculated:
from 01.01.2018 to 15.03.2018 -> OK
from 01.03.2018 to 15.03.2018 -> OK
from 01.01.2017 to 15.03.2017 -> OK
Deviation year to last year -> OK
from 01.01.2017 to 31.12.2017 -> ???
I thank you in advance.
Sorry, I don’t understand. Please ask a question at powerpivotforum.com.au with examples of what you have done and what you are expecting.
Thanks, Matt.
It’s really a good post.
I have one question on dimensional modeling. In MDX generally we can create one dimension as Date intelligence and the attribute in the dimension have all members like YOY, MOM,YTD, QOQ,QTD, Previous month, etc… And with MDX code we can define individual members with their respective formulas. In that case its helpful for me to get all time intelligence by all measure groups. For example: I have 5 measure group and each group have let’s take 10 measures. If i need time intelligence for all measures I need to write individual code for individual measure. But with dimensional modeling same dimension can use for all measures and as a result it will give all time intelligence value. so that one formula can be use for number of measures. How can we build the same model in DAX?
I guess there are various ways. One way is to write all the measures (Act, YTD, YOY etc) and then write a SWITCH measure to swap between these things. Yes you have to write all the measures, but that is not that hard.
Hi Matt, I am new to BI. Seeing the slicer in your example, it seems to me that the maximum year value is 2004. Thus, MAX(Calendar[Year]) would be equal to 2004 and not 2003 since ALL(Calendar) removes slicer filter . Please can you help me to understand this point?
FILTER has 2 parameters FILTER(Table,Formula). The Formula portion operates in the initial filter context without regard to what has happened in the Table portion. That is why it returns 2003 and not 2004
Thank you Matt.
Hi Matt,
Wow! This is the first time I’ve seen this important detail! Could you please refer me to any documentation or link were this is explained?
Thanks!
I’m new to Power BI, I’m looking for rolling 12 months calculation in Power BI.
if I select any one value from the month slicer, then, the bar chart should show last 12 months of values (each month value not cumulative).
Example :- if I select “November 2017” from the slicer, then, bar chart should show from “December 2016” to “November 2017” (which means, including selected value also).
Hope I have explained clearly.
Can any one please help me…
You can do that with the inbuilt function SAMEPERIODLASTYEAR() . Something like this
=CALCULATE([Total Sales],SAMEPERIODLASTYEAR(Calendar[Date]))
Reference guide for DAX could be downloaded from Microsoft web site. It doesn’t include newer functions. To get download link just type this search in google:
data analysis expressions – dax – reference filetype:pdf site:download.microsoft.com
Yes, this reference guide with 360+ pages is a great resource. My 15 page quick guide doesn’t attempt to compete with this.
Someone reached out to me about your Guide, the link is at the Top of the Article, depending on what browser you are using.
Hi Please send me your free DAX guide. Thx
The link to download is at the bottom of the article on this page
Need DAX guide
There is a link to download the guide at the bottom of the article above.
Matt – I’d love the free reference guide! Thanks in advance,
Tina
Thanks so much for the free DAX reference guide, Matt. Your explanations are always so clear and with great examples.
You are welcome. I’m always looking for new topics, so please share anything you would like to see me cover in the future
Thanks for your blog. It is extremely well written and is my primary source along with the aussie books recommended by you.
I´m quite new to BI. I tought I was doing fine with an “advanced” excel including array formulas and basic VBA. After that I changed to a job doing more operational tasks so I pretty much stopped studying excel since 2010.
A couple weeks ago since I discovered the Power BI suite and SSBI supplements I am extremely excited and want to implement it pretty much in everything!
One problem that I am having trouble to find some literature is about dealing with SCD. I feel I still have no base or the solutions are pretty much out of the box. Can you do some post about that? I would appreciate it very much!
Thanks again, and excellent work!
PS: Sorry for my bad and rusted english.
Hi Renato. I’m glad you like my blog. Unfortunatley I don’t know what SCD is. Can you provide more context?
As far as I know SCD is slowing changing dimensions in which the values of your lookup tables change over time. Depending on how your database is structured you may encounter some problems to tie your data in a historically correct manner.
The closest thing I got from this by googling was at this post http://blog.gbrueckl.at/2012/02/handling-scd2-dimensions-and-facts-with-powerpivot/
but the sample file doesn´t have any relationship between the tables, so I think the implementation might be not trivial.
In my specific case, I have an inventory problem with several tools that are used in several locations, so each row in the data table is the tool going from location A to location B, but the total amount of tools may change every 6 months or so. Every week we take a snapshot of which tools are in which locations, so you start with the snapshot of the number of each tool inevery location possible and build the final status in the end of the report.
The other thing is that the responsible for each location changes every couple months, so it´s kinda hard to keep track of it too.
Thanks in advance!
Ah yes, slow changing dimensions. I know what they are (clearly I just don’t know the abbreviation). It is an interesting problem because it is something that is normally dealt with by IT, not by self service BI users. But I understand there may be a need. I will add it to my list of blog topics (although I am normally driven by what ever takes my fancy at the time 🙂 ).
The inbuilt time intelligence of DAX covers 80% of most business requirements. The irritation comes from the other 20%. In my 20% list are these,
1. Current MAT, MAT LY, MAT 2 Years.
2. Calculating Week number based upon MAT.
3. 3,3,4 or 3,4,3 weeks to a Qtr.
2. Changing YTD, Qtr or MAT to a Financial Year start, changing the week start from Sunday to Monday.
I’ve worked around these irritations by adapting the Date Table. However, I would have thought that these measures are De-rigueur now and would have been included.
It only covers 80% of business requirements for businesses using a gregorian calendar at a day level of granularity. Deviate from that and you get nothing 🙂