One common requirement I have come across a few times is to limit a Power BI visual to only show completed months and exclude the current active month. This is common if you load data on a daily basis, but some of your reporting is done on a monthly basis. The chart below is a good example.
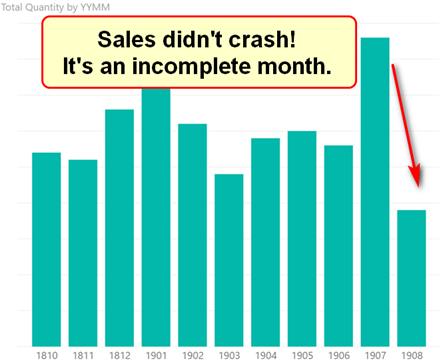
This chart shows the monthly sales of books from my online shop over the last 10 months. It looks like the sales have fallen off a cliff in August 2019, but that is not the case. This chart was generated early in the month of August and hence it shows a partially completed month. Probably the best way to make this chart reflect reality is to simply filter out the current (non-completed) month – August 2019 in this case. But the trick is to do this dynamically so the chart will still automatically update once the full month is complete.
As usual in Power BI there are various ways to solve this problem. The way I like to do it is to create a calculated column in the calendar table (you could use Power Query too). There are multiple ways to create a calculated column – but here is my solution.
Is this a Completed Month?
I solve this problem by creating a column called IsCompletedMonth. My column returns TRUE() for completed months and FALSE() for the current and any future months. I generally advise against using calculated columns and suggest you use measures instead. The exceptions to that rule include:
- When you want to slice, dice and filter on the result (you can’t do this with measures).
- When you are adding the column to a lookup (dimension) table (lookup tables are generally smaller and hence an extra column has less impact).
- When the column has a low number of unique values (low cardinality columns compress very well, even in large tables).
In this case I satisfy all of those exception rules listed above, so we are good to go.
Prepare The Calendar Table First
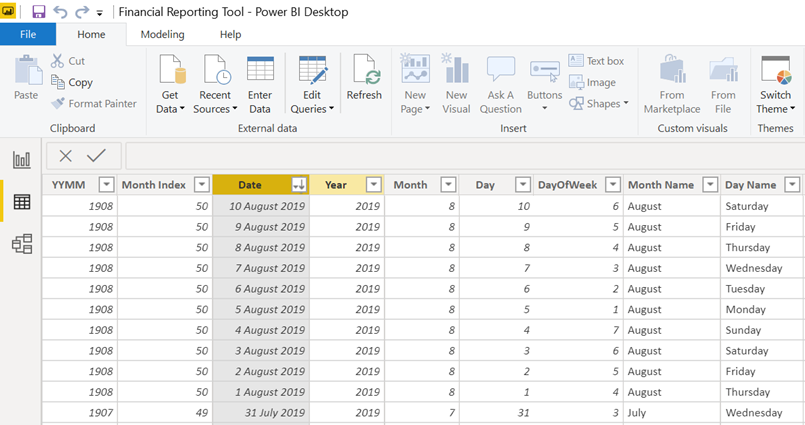
I think one good practice in a calendar table is to have a month index column. The month index is an integer column that uniquely identifies every month in your calendar table. The integer column should start at 1 for the first month loaded, 2 for the second month, 12 for the last month at the end of the first year and then continue on 13, 14 …24 at the end of the second year and so on. The benefit of doing this is that you can do mathematical calculations in order to find relative months, such as – 1 to find the previous month, – 12 to find the same month prior year and so on.
Once you load your calendar table with a month index column you’re able to use a combination of the TODAY() function and also LOOKUPVALUE() in order to find out what month index is the current active month.
Completed Month =
      VAR ThisMonthID =
              LOOKUPVALUE('Calendar'[Month Index], 'Calendar'[Date], TODAY())
      RETURN ThisMonthID
LOOKUPVALUE() is a lot like VLOOKUP() in Excel, but the syntax is in reverse.
Excel VLOOKUP(<Find This Value>,
              <In This Column In Another Table>,
              <And Return The Value From This Column>
      )

DAX LOOKUPVALUE(<Return This Value From This Column in Another Table>,
                <By Searching This Column In Another Table>,
                <And This Is The Value To Search For>
      )
The benefit of LOOKUPVALUE() over say RELATED() in DAX is that you don’t need a relationship. All relationships come at a cost in Power BI. You should only create relationships in Power BI when you want to propagate filters from one table to another. If you just want to fetch values from another table into a second table, then use LOOKUPVALUE() instead and skip the relationship.
At this writing, the current date is 10th Aug 2019, and as you can see below in my calendar table, the Month Index for Aug-19 is the value 50.
And my new (partially written) calculated column [Completed Month] returns 50 for every row in the calendar table. Note how I have only partially written this formula and returned the value of the variable to “see” that this part is working as desired.

Now that I have used LOOKUPVALUE() to find the Month Index for today’s date, I can compare this against the month index column for every date in the calendar table to work out if each date is in a completed month or not. Here is the modified formula.
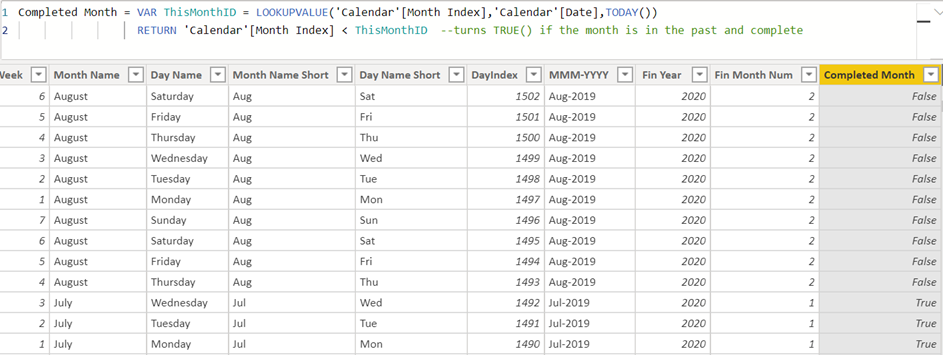
Completed Month =
      VAR ThisMonthID =
              LOOKUPVALUE('Calendar'[Month Index], 'Calendar'[Date], TODAY())
      RETURN 'Calendar'[Month Index] < ThisMonthID
          //returns TRUE() if the month is in the past and complete

And here is the resulting column in my calendar table (below). Note that all dates in the current month (Aug-19) are FALSE, and all dates from Jul-19 and older are showing TRUE.
Now I have this column, I can use it as a page or visual level filter in my workbook. The chart is no longer misleadingly showing me that my sales have plummeted in August.
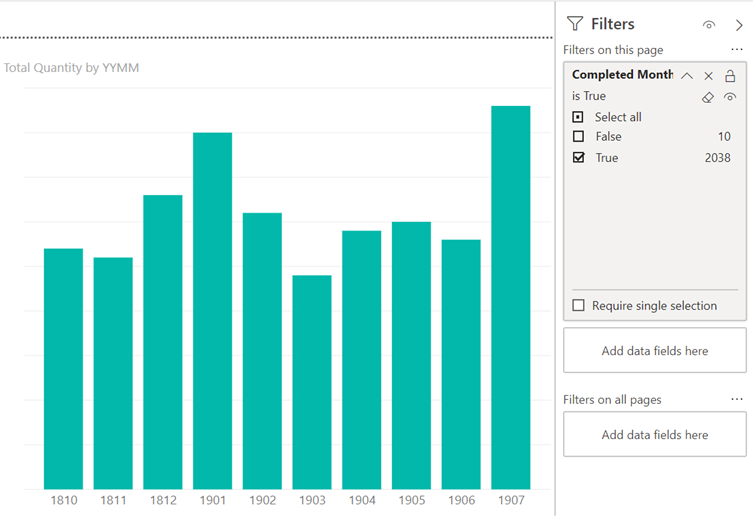
When I refresh my report in September, the calculated column will update and the August sales will automatically be visible.
How Do You Filter Your Completed Months?
Do you use a different approach? Let me know how you filter your completed months in your Power BI reports in the comments below.
This is quite a complex problem. My understanding (and interpretation) is that the “rules” of what is the end of month can move. Anytime there is ambiguity, there will be problems. Can you perhaps write a calculated column that will update on refresh that will indicate what you need? That is what i try to do.
Hi, I use a month index and certain measures reference it e.g. a measure to calculate the forecast for the current month will reference the month index number 0. A problem I’m having is that the month end routine spans the end of one month and the start of the next so as an example while working on the November month end, in November the November month index is 0 but come the 1st of December the index no. for November will update to -1 so my current month forecast measure will bring back the incorrect value i.e. December’s forecast. I use the datediff formula for the month index but as it uses today() that’s causing the problem. Can anyone suggest a datediff syntax that will pick up the last day of the month I’m working on or another workaround?
Hi Matt,
I create a date table in Power Query and create a new column based on the current month. If the date is in the previous month or earlier, I let it return “Completed”. If not, then “In progress” (current month) or “Future” (future months).
Hi there Matt. Thanks for that. I have relative month and relative year columns – Relative Month=
DATEDIFF(TODAY(),’Date'[Date],MONTH) so that this month / year is always 0. Ruth from Curbal suggested this approach – it’s simple and enables me to filter with reference to this month. What do you think?
I think it is good 🙂
Completed Month = eomonth(‘Calendar'[Date],0) < today()
Easier / more direct maybe…?
Or if one instead wants to only show months that have (presumably) fully loaded:
Completed Month = eomonth('Calendar'[Date],0) < max(TransactionsTable[Date]) — where TransactionsTable is just a fill in for whatever Data table one is concerned about.
Thanks for yet another great tutorial!
Couldn’t you just use an IF statement to filter out the current month?
Yep. As long as you can identify the current month, you can do it. Jes posted another way in the comments below. I did it they way I showed because that’s what came to mind when I wrote it ?.
In this case just use a filter, of type Relative Date and select Calendar Months which ignores incomplete months.
In general it’s best to push values to the lowest layer possible in your stack, as it improves performance and reusability (and becomes platform agnostic).
A computed column in your date dimension that does a datediff in months between the date record and current date will give you a dynamic relative date value.
I see the issue a bit different: Even after the month has ended, perhaps not all data was entered.
Moat common will probably be In a finance model. Often even if it is now August, and some data of august was already entered, there very often is a situation that July is not yet all written. So I’d rather no one will see not only August but also July.
I like to keep things simple to maintain, and I’d do it this way:
My Date Table is an external Excel sheet. I have an extra column in it with a relatively simple Excel function returning either : “To include in Reports” or ” Not to include”.
The function looks at a Cell with a date in it (usually an end of month), and has to be changed once a month manually by an administrator, when all data for the last month was entered (what might happen on different dates).
Than data in reports is filtered by this column in the date table to include only Dates “to include in report”.
You need to build a solution that meets your needs, of course. What you describe is pretty common in finance, where you need to wait for the month close before loading the data.
YES
Calculated column:
Completed Month =
VAR dateoftoday =
TODAY ()
RETURN
DATE ( YEAR ( dateoftoday ), MONTH ( dateoftoday ), 1 ) > Calendar[Date]
Jes.
In Power Query I do this
1. Limit my calendar to today and prior
2. Group the calendar table on the months keeping all rows
3. Sort descending
4. Create a new index column
5. Ungroup the rows.
I do this for many different periods that we use in our business. Thus the current month is 0 (or 1) depending on your index and the index can be used as a filter.
I usually create a relative month column as you mentioned to perform these kind of operations. Instead of true/false I like to create a column with 0,-1,-2 (Completed Month – Month Index) that I can use in filter pane or measures.
For instance, Sales (Completed Months) would be:
CALCULATE([Sales],KEEPFILTERS(‘Calender'[Relative Month] < 0))
Nice idea
Hi Matt, I’m using the relative date filter: selecting “in the last xx calender months”
This filter limits the date to 31.07.2019 (current month August is not included) 🙂
Hi Matt, now I saw your comment below.
In my power BI model (version July) this function works as described above. There is a different selection possibility: “in the last xx month” – this will include August figures as well as it is not limited to calender month.
Matt, excellent solution for this problem. I would love to see it implemented in Power Query.
Hi Matt,
This may seem silly, but could you please explain why the entire Completed Month column gets filled with Month Index 50? If the value search was unsuccessful, shouldn’t it be a blank value?
Thanks
If you look at the formula:
Completed Month = VAR ThisMonthID =
LOOKUPVALUE(‘Calendar'[Month Index],’Calendar'[Date],TODAY())
what it is saying is get the Month Index value from the Calendar where the data is equal to Today. It is always only looking for one record and it is always the same record, the one with today’s date. It’s not actually considering the date of the row it is being calculated in.
I have a measure called “startofMonth” that uses the formula =Date(Year(Today()),month(Today()),1), i.e. it carries the first day of the current month. In my subsequent measures I can then use this formula (I have a Calendar table that has a relationship to my fact table) :
Monthly total = If(Max(‘Calendar'[Date]) <= [startofMonth], [myTotalMeasure],BLANK())
Works a charm. Especially, since I can change the value of "startofMonth" to roll back time and pretend it's May instead of August, which is handy for testing.
Hi Matt,
How do I create a Month Index?
Excellent solution. I’ve used the inbuilt relative date filter but it has a limitation in that it locks you in to a rolling date range. Thanks Matt
Honestly, I just use the handy “Relative date filtering” and use “is in the last” “X” “calendar [weeks/months/etc]”. Works like a charm for me.
That feature does lots of useful things. But how do you use it to stop the current part month from loading while still loading the previous data? eg today is 20th Aug (in Australia). So how do you use this feature to load data up to 31st July while not loading any data until August? And from 1 Sept, it automatically switch to loading the August data.
If you select “is in last month”, it will include all data until today. If you select “is in last calendar month”, it will only include data of the last closed month so July in your example and then August once it’s Sept 1st.