Level: Advanced
The EARLIER() and EARLIEST() functions are 2 of the harder functions in DAX to get your head around. If you come from a programming background it will probably be easy for you. However as I have repeatedly stated on my blog, one of the many great things about Power BI is that it is accessible to mere mortal Excel users like you and me. You don’t have to be a classically trained IT programmer to be a Power BI report author. Inevitably however there will be harder concepts that you will indeed need to learn if you want to progress from a beginner to intermediate to an advanced user.
Sample Data
For this blog I will use my simplified Adventure Works database to look at some insights into total customer purchases and customer value. For this blog I am going to write some calculated columns that are not necessarily best practice, nor are these formulas necessarily the best way to solve the problem. These examples are contrived to demonstrate the concepts of EARLIER and EARLIEST only.
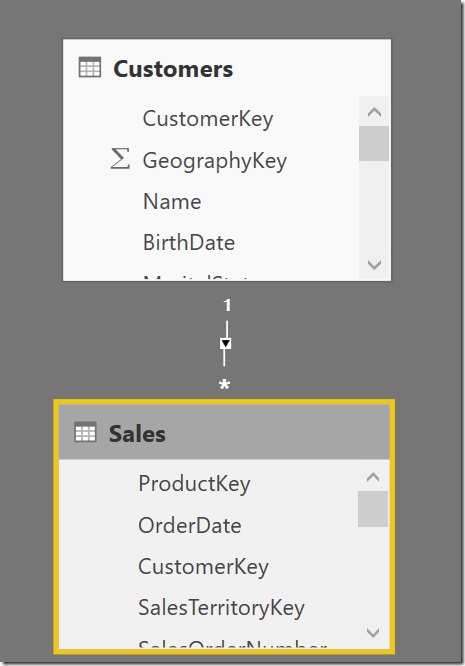
There is a Customers table that contains all the unique customers (uniquely identified by the Customer Key) and there is a sales table that contains all the sales records for each customer. There is a one to many relationship between the tables.
Row Context
Row Context is the term in DAX that means “row by row evaluation”. Simply stated, it means that the same formula is executed one row at a time to return a (potentially different) result for each row. A row context exists inside all calculated columns and also inside some special DAX functions such as FILTER(), SUMX(), RANKX() etc. Let’s take a simple example using Adventure Works.
I have the following measure
Total Sales = SUM(Sales[ExtendedAmount])
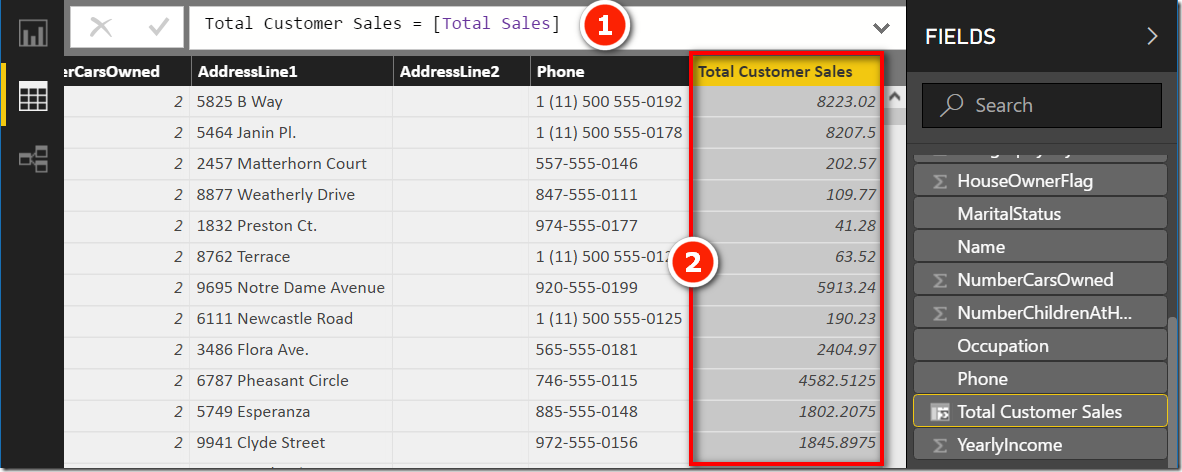
When I add this measure into a new calculated column in the Customer table, I get the following result (a new calculated column called Customer[Total Customer Sales]).
Despite the fact that there is only 1 DAX formula (shown as 1 above), there are many different answers returned to the column (shown as 2 above). The simple explanation is that the formula is executed one row at a time, and each result is stored in the new column. The more technical explanation is this:
- A calculated column has a row context. Each row will therefore be evaluated one row at a time.
- The first row in the row context is selected.
- [Total Sales] is a measure and has an implicit CALCULATE. The implicit CALCULATE converts the row context into an equivalent filter context. Now there is a row context AND and a filter context.
- Because of the implicit CALCULATE, the filter context on the single customer propagates through the relationship from the one side to the many side.
- The Sales table now has a filter applied so that only sales for this one customer exist in the filtered copy of the Sales table.
- The measure [Total Sales] is then executed and is SUMs up all the sales for that one customer.
- The result is stored in row 1 of the new column.
- Steps 2-7 are repeated for each row in the row context created in step 1.
Nested Row Contexts
Once you are clear what a row context does, hopefully you can imagine that it is possible to have multiple nested row contexts inside a formula. Let’s take another example by now ranking the customers based on their Total Sales. Here is the formula.
Customer Rank = RANKX(Customers, [Total Sales])
And here is the result showing the new column.
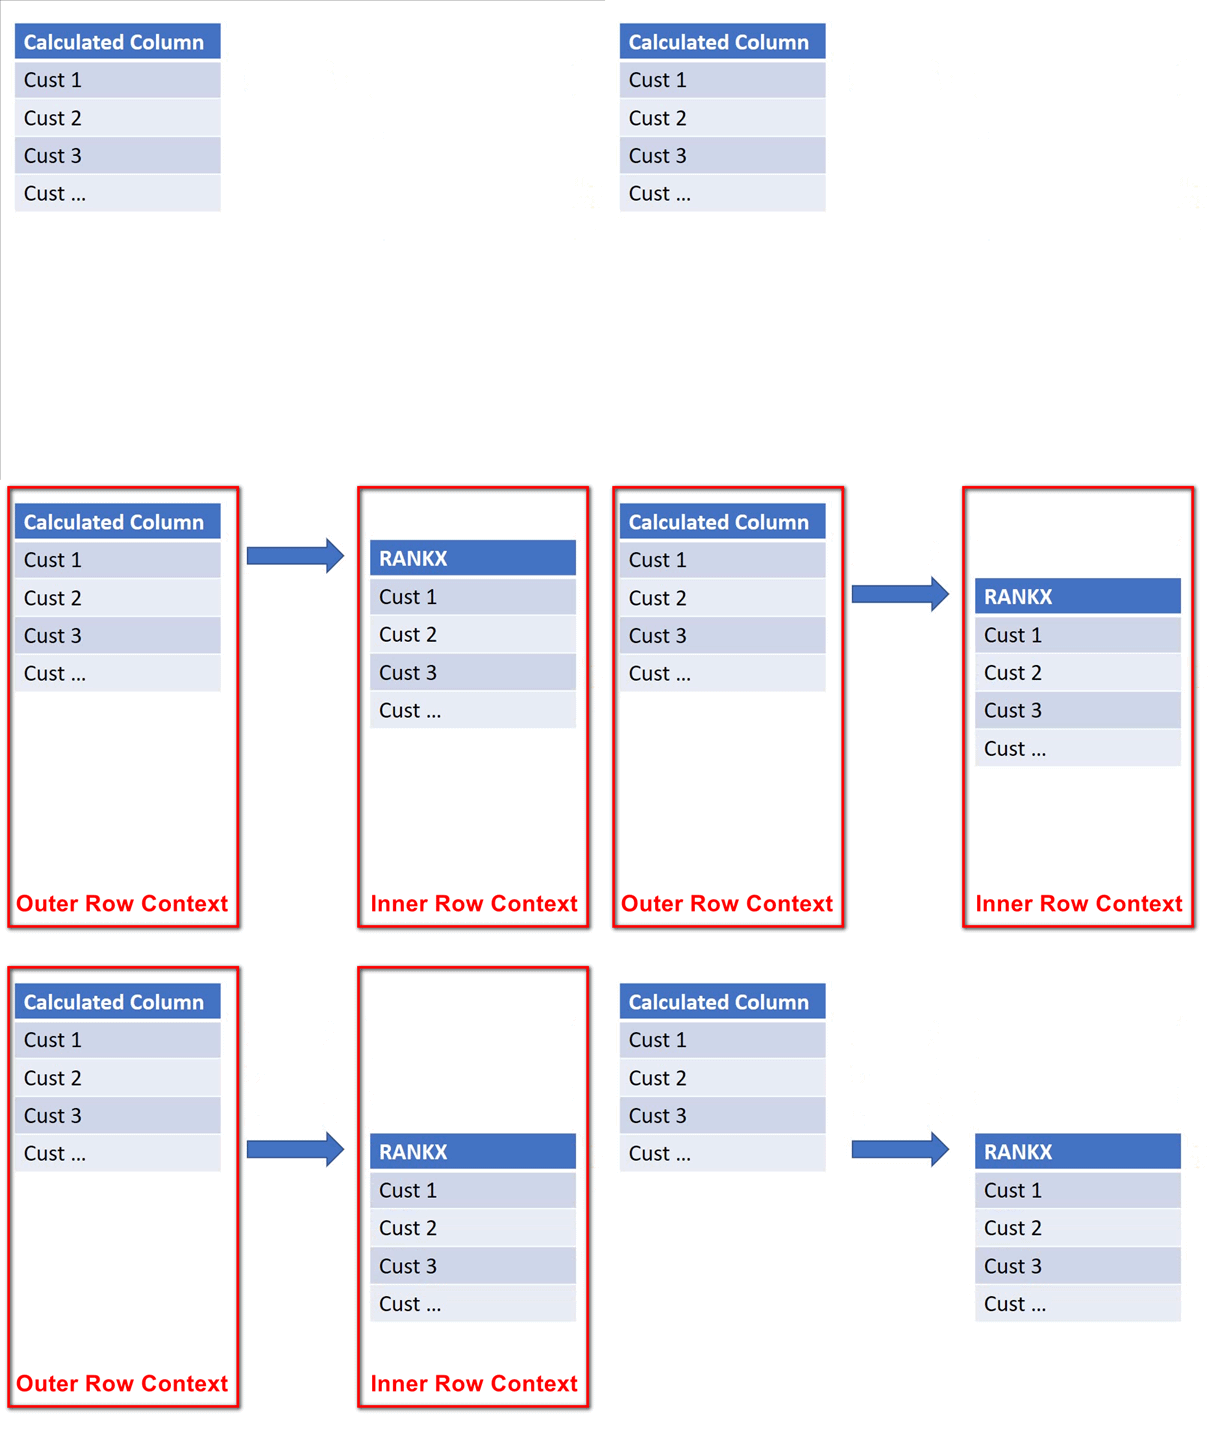
The simple explanation on how this formula works is this. It first works out the total sales for each customer, then ranks the customers based on those sales. A more technical explanation is that there are now 2 nested row contexts, an inner row context (RANKX) and outer row context (Calculated Column). The inner row context is executed for each of the outer rows as illustrated below.
The full technical description of how it works is as follows.
-
- A calculated column has a row context. Each row will therefore be
evaluated one row at a time. - The first row in the customer table in the calculated column is selected.
- The function RANKX also has a row context over the customers table. Now there are 2 row contexts, the first one created by the calculated column (outer) and the second one created by RANKX (inner).
- RANKX goes to the first row of the inner row context. Nothing else will happen to the outer row context until RANKX is finished its job. At this stage, the RANKX function is trying to work out how this single current customer (the one identified by the outer row context) compares (ranks) against all other customers. But it can’t do this unless it knows the total sales of each and every customer. So it has to work through the entire Customer table and work out the total sales of every customer before it can rank them.
- [Total Sales] is a measure and has an implicit CALCULATE. The implicit CALCULATE converts the inner row context into an equivalent filter context. Now there are 2 row contexts AND and a filter context.
- RANKX repeats the process of working out the sales for each customer in the customer table.
- Once it has evaluated the total sales for each customer, RANKX works out where this single customer (the one identified by the outer row context) ranks compared to all customers.
- The process is repeated for each row in the outer row context.
- The calculated column returns and stores the rank for each customer into the final column.
- A calculated column has a row context. Each row will therefore be
Ranking Customers FILTER Version
Another (manual) way to rank customers is to count how many customers have more sales than the selected customer. E.g. The largest customer will have no other customers with more sales, the second largest customer will have 1 customer with more sales etc.
If I were to try to write this formula in pseudo code, it might look like this.
Customer Rank FILTER =
        COUNTROWS(
           FILTER(Customers,
             Customers[Total Customer Sales] >
                 'sales of the current customer being considered'
           )
        )
The formula above has 2 nested row contexts, one from the calculated column and a second from the FILTER function. The way the formula works is as follows.
- The calculated column creates a row context.
- The first customer is selected
- The FILTER function creates a second (inner) row context.
- The FILTER function works through every customer in the inner row context to determine which customers have sales greater than the “current customer being considered”.
But what is the current customer being considered in the test? It is the customer from the outer row context of course. So how can this formula be written. The following would be wrong.
Customer Rank FILTER =
        COUNTROWS(
           FILTER(Customers,
             Customers[Total Customer Sales] >
                 Customers[Total Customer Sales]
           )
        )
The above formula can’t work because the comparison check inside the FILTER is wrong. The formula needs to compare the total customer sales in the FILTER (inner) row context with the customer identified in by the calculated column (outer) row context. This is what the EARLIER function does. It tells the formula to escape from the inner row context and go and fetch the value from the previous (outer) row context. Here is the correct formula.
Customer Rank FILTER =
        COUNTROWS(
           FILTER(Customers,
             Customers[Total Customer Sales] >
                 EARLIER(Customers[Total Customer Sales])
           )
        ) + 1
Note I have to add 1 to the final result because the raw formula will return 0 customers that have more sales, hence adding 1 will correctly create the ranking starting from 1.
So What About EARLIEST?
The EARLIER function by default refers to the row context that immediately preceded the current row context being considered. In the examples used here there have only been 2 row contexts, the outer and the inner. Given there are only 2, when using EARLIER within the inner row context it is always referring to the outer row context. In this case, EARLIER and EARLIEST refer to the same outer row context. If there are more than 2 row contexts, the EARLIER function accesses the previous row context by default (starting from the inner and moving out) and the EARLIEST function refers to the outermost row context. But did you know that EARLIER has a second optional parameter?
EARLIER(<column>, [number])
The optional second parameter is 1 by default (if omitted). But you can specify how far back you want to reach through a number of nested row contexts as illustrated below.

I can’t even think of an example formula to demonstrate where using EARLIER and EARLIEST will return a different result, but I guess it is possible. If you can think of one, please post it in the comments and I will update this article accordingly.


Yes, you can use EARLIER in a measure, but only if you have a row context. RANKX has a row context, as do all the X functions, plus FILTER and various other functions.
Hi Matt – One question, we are using Earlier in a Calculated Column, Could it be used in a measure? Since I was successful in using RANKX in a measure, i was curious if Earlier can be used in a measure as well. I tried to do a ranking in a measure using Earlier but it was throwing an error.
Love this explanation – trying to see if it may help to accomplish what I’m looking to do.. which is –
I have an opportunities table (table 1) with ‘OpportunityID’, ‘Customer’, ‘Product’, and ‘Win Date’ and have added a ‘CustomerProductID’ column.
and separately, I have a ‘Sales’ table (Table 2) with ‘Customer’, ‘Product’, ‘sales date’, and ‘sales amount’ for every month of sales for the last 10 years, as well as a ‘CustomerProductID’ column.
I’m trying to come up with a way to sum all sales that have happend after each date on the opportunity table with the matching ‘customerproductID’ from the sales table…
that is to say that for every CustomerProduct ID on table 1, find the earliest date and add all sales from table 2 with the same customerproductID that have occured after that date, and then find the next earliest date for that customerproductID on table 1 and then sum all sales that have happened after that next date from Table2…
I know it’s using earlier somehow – but i can’t quite get it right…
Not sure how to take your rank example and instead, get a sales amount calculated column onto my table1 using the logic explained above…
any thoughts on what I might be able to do?
I doubt this is an “earlier” problem, but it is hard to say without seeing a sample. I suggest you create a sample Power Pivot model with sample data and show what you are trying to achieve, then post at a forum such as Mr Excel, Community.powerbi.com or powerpivotforum.com.au
Great howTo. Thanks.
But you should tell how the measure Customers[Total Customer Sales] was created. This makes the Post complete.
Hi Philipp. Customers[Total Customer Sales] is not a measure (note it has the table name first indicating it is a column). I showed how to write this column in the section titled Row Context. I have updated the blog to make it clearer.
Hello Matt,
Is there way to convert a measure into table/column that the function EARLIER can use?
I don’t really understand what you are asking. Any column can refer to a measure, so I guess the generic answer is yes.
Thanks Matt for the article.
Great again. Thanks Matt!
Great explanation
Thanks Matt, an excellent explanation of RANKX formula. Is this applicable both in Power BI as well Power Pivot.