Level: Beginners
I think today’s article will be of interest to my readers even though it is a little astray from my normally pure Power BI, Power Pivot and Power Query content. I will show you how to quickly and easily create an On-Line Survey that you can distribute to anyone that has an Internet connection, and then use Power BI to report on the results from your survey.
Office 365 Excel Surveys
You may not be aware that O365 has an inbuilt Excel survey tool that is very easy to use. And who wouldn’t want to use Excel to solve a problem if they could? You can find the survey tool by going to OneDrive online. I am using OneDrive for business for this demo, but it also works for OneDrive Personal.
Here is Survey – Please Participate
For demonstration purposes, I have created a survey to ask my readers what they would like to see more of on my website and to see which countries the readers live in. Edit 7 Feb 2016. The survey is now closed, but you can still read on.
Now that you have completed the survey, read on to see how you can do the same yourself and to see the latest results via an embedded a Power BI report at the bottom of the page. Note that it can take up to 1 hour for your specific survey response to be available in the report (ie it is near real time – not real time).
How I Created the Survey
First Open OneDrive Online
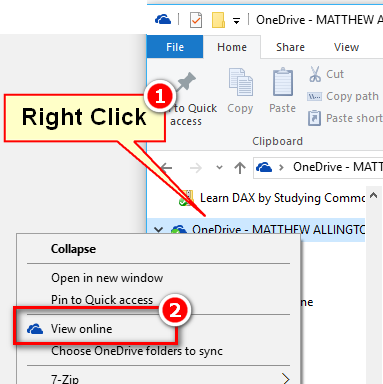
Frankly I get confused with all the logins for Microsoft sites. The easiest way I know how to login to OneDrive Online is to Open Windows Explorer, right click on the OneDrive folder and then select View Online.
Create Your Excel Survey
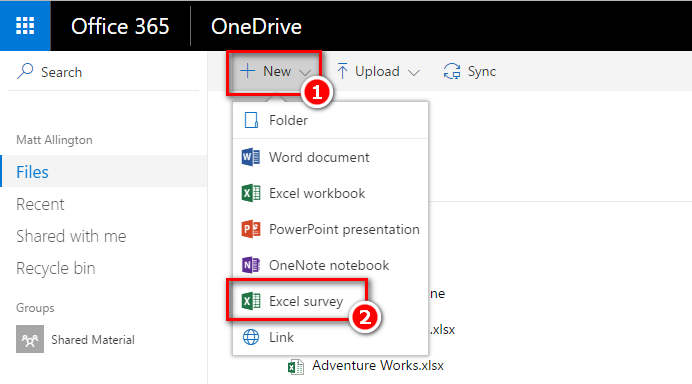
Creating an Excel survey couldn’t be easier. Just click New\Excel Survey as shown below.
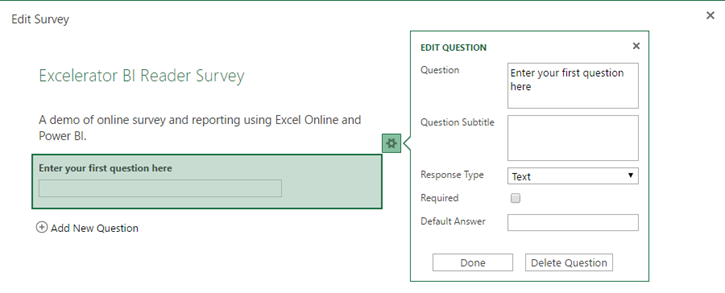
I immediately got some survey header information to fill in as shown below.
There are no user manuals required to work out how to do this. I just updated the information and moved on to the next section. It is easy to enter the questions you have, and there are a number of intuitive response types that you can choose to meet your needs.
Survey Results Database
After you have completed your survey, you can see the underlying Excel spreadsheet that stores your survey results. It is possible to add new columns to the right of the results table. Additional columns added manually can be used to store information you want to add without it being part of the survey.
Connecting the Data to PowerBI.com
There are a few ways you can create a Power BI Report. If you want a fully featured data model including the ability to import other tables of data and write your own DAX, then you need to import this new data source into Power BI Desktop as you would with any other report. For this demo today, I have use the “Get Data” feature from directly inside Power BI Service to connect to the Excel workbook on OneDrive. To do this, I first logged into PowerBI.com and selected get data from files as shown below.
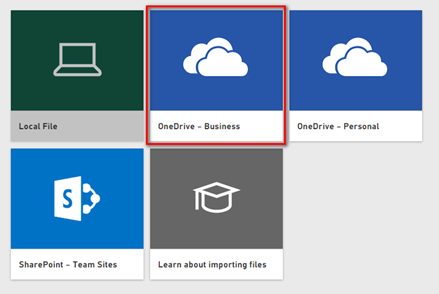
Then I selected OneDrive – Business as shown below.
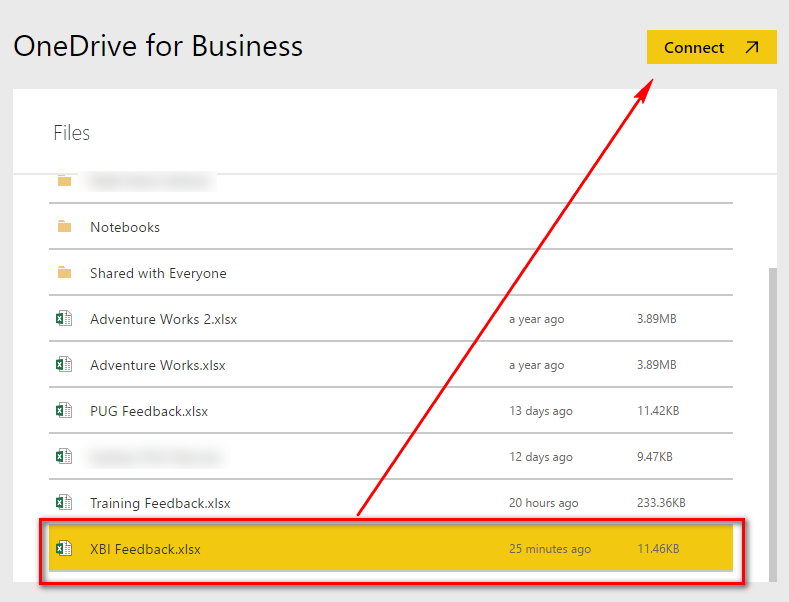
Then I selected my survey file and clicked Connect
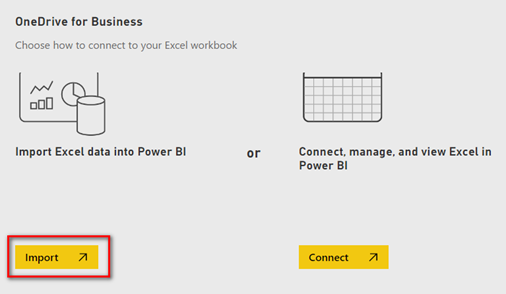
I was then prompted to either import the data or connect. The connect option works just like Excel Online – not what I wanted. So I selected Import. When you use import in this way, Power BI will check your OneDrive account about once each hour to check for new data and will automatically update your report.
Power BI then created a new Dataset for me (1 below). You can see the table of data shown in 2 below. It also created a Dashboard, however this was not much use so I simply deleted the dashboard.
Here is the Final Power BI Report
Once I had the data connected, I simply created a few simple visualisations using the capabilities of Power BI Service. You can see the final interactive report below.
Be sure to read next week’s post where I cover how you can use Power BI Desktop to model your online data. https://exceleratorbi.com.au/data-modelling-onedrive-source-files/






Thank you Matt for your great article, i want to ask you if i can connect LimeSurvey to Bower BI with such manner.
Sorry, I don’t know of LimeSurvey, however if it is a web based tool where the data is available online, then my guess would be yes. But you would have to test it.
Thank you Matt, that makes the life much easier, now we can use this function in all meetings to get the data from the audience
Dear Matt,
First of all, great article. I have a question I have been trying to figure out for some time.
If I have conducted a survey via Survey Monkey, what is the best way to structure the data so that it can be easily viewed in PowerBI?
There is no easy answer to this, and I know the structure of the captured data can be sub optimal. Do you have a sample you can share publicly? If so, ask a question at powerpivotforum.com.au and alert me to the post. I will take a look, and maybe even write a blog about it if it looks interesting.
When the survey is submitted, does the dashboard automatically reflect the added survey answers?
No, it is not a real time data set. You need to trigger a refresh.
This is brilliant, I have business requirement with exactly these same requirements and I did not even know that it exists. I think I might end up even teaching some of the Microsoft account support on this!
Hi Matt, I was searching for an easy and light instrument to do survey and I had it without knowing.
You are the best!! Really
Thanks
Roberto
Thanks for addressing this very useful, and hardly noticed, Excel Survey functionality. I have almost given up to re-visit my favorites because of confusion with login to Microsoft sites.
I am constantly amazed by how you know this stuff! I love the survey capability and had no idea it existed. But, you know what I found more intriguing? I now understand how to use Office 365 (from your demo I now get it) but, the interactive Power BI I canvass just blows me away… seriously, I have to know how you do that.
Can the next Blog be on how to publish Power BI content to the web?
Always aim to please :-). I did an article some time ago about publish to web. You can read it here. https://exceleratorbi.com.au/power-bi-public-story-telling-is-pure-genius/