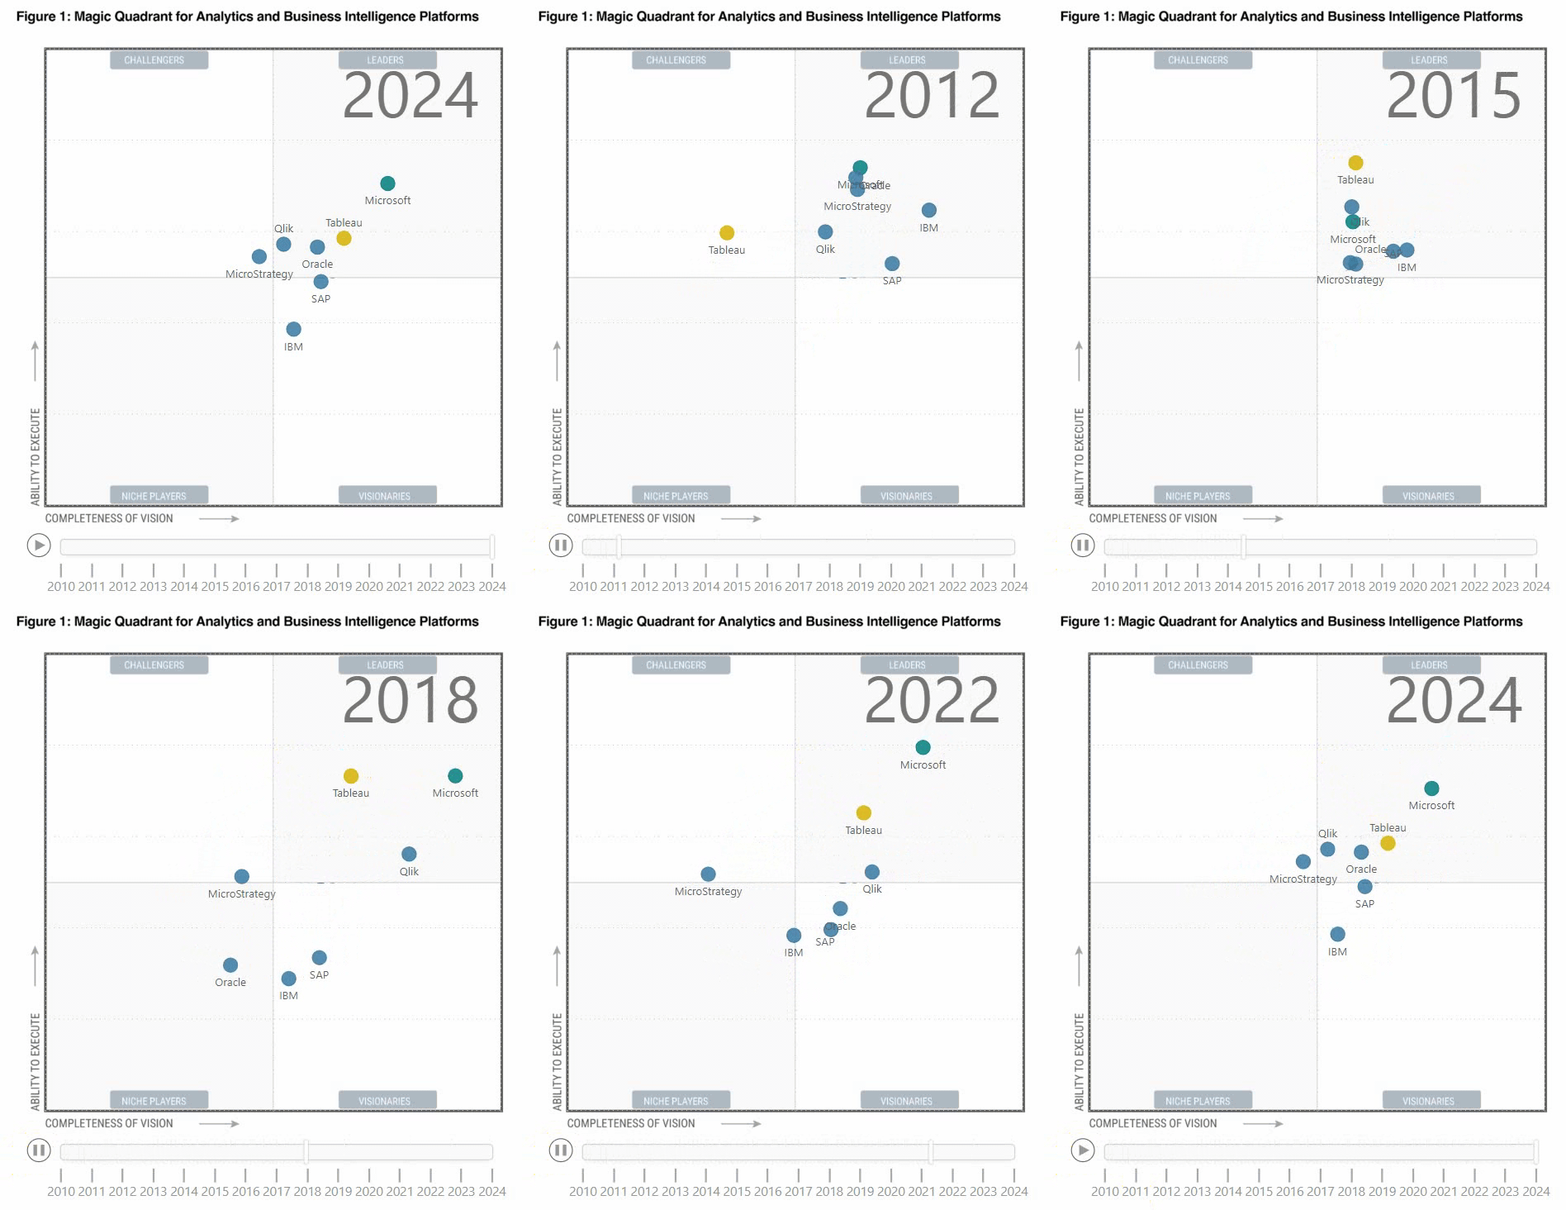
Updated June 2024
We update this blog article regularly to keep track of how Microsoft is progressing on its strategic journey in building a world class BI platform. Gartner released the 2024 Magic Quadrant for Analytics and Business Intelligence Platforms in June. As expected (by us at least), Microsoft is continuing its trail-blazing and has maintained a clear lead over the other contenders in both ability to execute and completeness of vision. Matt first wrote this article back in 2019 to highlight the emerging trend as Power BI took its place as a clear front runner on the Enterprise BI podium for the first time. Since then, we have been collecting the annual Gartner magic quadrant images and have combined them (2010 – 2024) into an animated gif (see below). The visualisation was built using Power BI (what else) so it is very easy to see the changing nature of the competitive environment. Note that Microsoft started behind the pack in 2010, but arguably hit the lead in 2018 as Power BI gained traction in Self Service Data Analytics, and has since set the pace for Enterprise BI platforms, well in front of the pack for the last 6 years.

This data was extracted from printed charts provided by the annual Gartner reports. To create this visual, we needed a way to extract the numerical data points from these images. The rest of this article shows you how to do that.
How To Extract Numeric Data Points from an Image
The following section is from Matt’s original post in 2019. If you missed it, you may like to take a look at how he created this visual in the video below. It is pretty easy actually, when you know how. The key is to use a simple data point mapping tool. The tool used to create the above visual was the WebPlotDigitizer.
Rather than document the steps one at a time, Matt produced a quick video that you can watch below. Note that this video is a few years old now, so it doesn’t contain all the data, but the current chart was updated using the same technique.

Thanks Matt!
Although according to the visual, ‘Completeness of Vision’ for MS has been on the decline since peaking in 2018 – most certainly not our experience!? I’m curious how Gartner would explain that? My only thought is that it is representative of a vision that continuously ‘expanding’ and therefore continuously further from ‘complete’?
And isn’t ‘Completeness’ – in a world of continuous improvement / continuous delivery – a bit an outmoded measure?
Nice post Matt
Hi Matt,
Please can you share your PBIX or the Excel file with us.
Thank you,
Vishesh Jain
Matt, that’s such an effective way to present the survey results changing over time. Thanks for all you do to help us learn and use these “Power Tools” so we can improve how we work with data.
That’s it. Just in time. Some times ago I searched for this technic. Thanks a lot.
Great idea. Love it!