Level: Intermediate to Advanced
Matt here. I recently met Parker Stevens online through LinkedIn – he too is a Power BI fan, just like me. Parker has shared a few techniques with me that I found very interesting. These topics have not been covered on my blog before and hence I thought it was a great opportunity for Parker to share some of his knowledge with you over a few blog articles in the coming weeks. Today’s blog is an introduction to DirectQuery mode in Power BI. This topic goes a lot deeper into the topic of SQL Server than I normally cover on my site (as it is not my core skill set). But there is still value here even if you are a Business Analyst or an Excel/Visualisation professional. It is important to understand “what” can be done even if you sometimes may need help from others to get it done – knowledge is power.
About Parker Stevens
Parker Stevens is a Business Intelligence Developer and the creator of the BI Elite Youtube channel. Through this medium, Parker shares his knowledge on all things Power BI and DAX. He has a passion for innovation within the Power BI space and has developed some interesting techniques to push the limits of the software.
Over to Parker.
Intro to DirectQuery
As of today, Power BI allows for you to connect to a relational data source in a few different ways. This includes Import, DirectQuery, and through a Live Connection when utilizing SSAS. In this post I will briefly discuss the advantages and disadvantages of using DirectQuery and then dive deeper into its execution to give you a solid understanding of what is going on behind the scenes.
DirectQuery is a method of connecting to a relational data source without the need copy the data into Power BI at all. This mode of operation has been available in Power BI for quite some time. It has long been hailed as a blessing and a curse among report building, as its solution to the problem of needing live data is known to come with its pitfalls of restrictions and performance hits. Luckily, the Power BI development team seems to have been investing a large amount of resources in making DirectQuery a definite topic of conversation. Without further ado, here are the reasons why you should or shouldn’t consider using DirectQuery in your report.
The Good
DirectQuery’s main draw is that it allows your report to always contain the most up-to-date data from your relational data source – it is a live connection to the relational data source. As opposed to its counterpart, “Import,” that requires you load a snapshot of the necessary data into the model during refresh, DirectQuery queries the data source for data with each time there is a change in filters. This ensures that your report is constantly “live.” This is a big advantage if you a working with a database that is constantly being updated, similar to an OLTP (Online Transaction Processing) system that you would find in a company that deals with any form of order entry.
Another advantage of DirectQuery is its unrestricted data size limits. Since Import loads all of the necessary data into memory, Power BI has imposed a 1 GB limit on the size of any single data model. With DirectQuery, the system that stores data in memory (known as the VertiPaq engine) is not enabled, alleviating any size limitations. Instead, you are able to query petabytes of data stored in your relational database while you worry only about the speed in which the data is returned. For an example, here’s a look at the size of two PBIX files after loading the same data by both Import and DirectQuery.
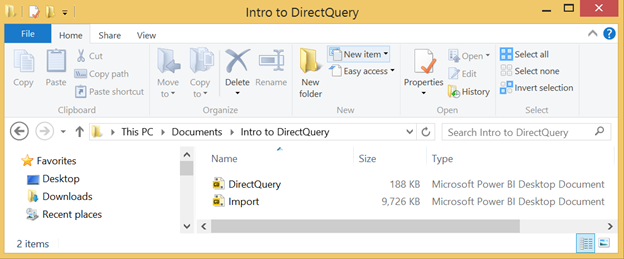
Note: In reality I’m working with the AdventureWorksDW2012 database which is miniscule in comparison to enterprise databases.
The Bad
The area where DirectQuery falls short of its opposition is its limitations to DAX and MDX functions. Any Power Query transformation that alters the original data source (which is pretty much all of them) is not permitted. DAX functions, on the other hand, fall into one of two categories: Optimized for DirectQuery and Not Optimized for DirectQuery. Here is a link to the page specifying which functions are optimized and which ones aren’t. You can find a link to the page that specifies which functions are optimized for DirectQuery here https://docs.microsoft.com/en-us/sql/analysis-services/tabular-models/dax-formula-compatibility-in-directquery-mode-ssas-2016?view=sql-analysis-services-2017. This is broken down even further to specify if functions are optimized for use in all calculations or only measures. The rule of thumb here is that you can use all DAX functions in measures with varying performance, but only functions dictated as “Supported in all DAX formulas” are allowed for use in calculated columns.
The second biggest limitation in my opinion is that you are confined to only one data source. This is pretty important to know, although I admit that I don’t often have reports containing more than one data source. For an RDBMS, this typically means only one database. The workaround for this is connecting DirectQuery to “Views” (eg SQL Server Views) that pull from different databases. With this approach, you can even pull data from different servers if you have linked servers set up, although this could impact performance.
Finally, a large and probably obvious disadvantage of DirectQuery is that it produces a considerable number of queries being run against the database. In this method, every visualization on the page sends its own query to the database. Sometimes, a visualization will execute multiple queries. If you share this report with others, that could mean for a lot of traffic on your servers. In order to alleviate this issue, Power BI has implemented an optional feature called Query Reduction which adds an “Apply” button to all of your slicers. You must then click the Apply button when you decide that you want to query the database using your selections. This can be found in the Options under “Query reduction.”
A Look Under the Hood
In order to understand what is really going on in a report set up with DirectQuery, we should simply ask our data source. In the following example, I am setting up two queries via DirectQuery. The first query is taking a subset of columns from the FactInternetSales table in the AdventureWorksDW2012 database provided by Microsoft.

And the following query is some convoluted logic to grab the last query that hit the database (and also execute slowly enough to ensure that it is the last query run). While the query above is pretty easy to understand (even if you don’t know TSQL), you don’t need to understand the code below at all. Just understand that I have written this to demonstrate how Power BI can directly access data from a relational database like SQL Server.

With these two queries setup, we can drag a couple of visuals onto the canvas. Let’s start with a Line Chart containing the OrderDate as the Axis and SalesAmount as its value. Let’s also throw in a slicer containing the OrderDate. Finally, we will add a card containing the “Query” field from the second query. You should have a report that looks something like this:
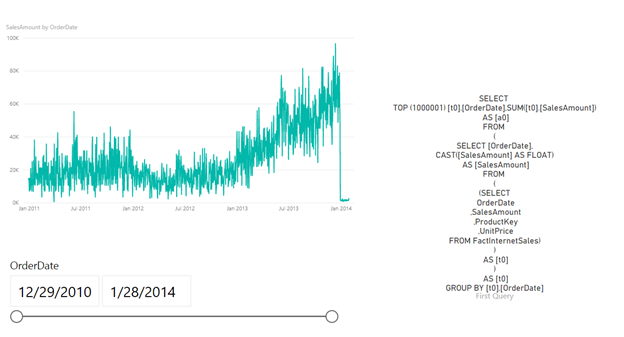
Since we can see the last query that was run against the database, we can begin to know what Power BI is sending to the backend. And if we move the slider to show an OrderDate range of 10/7/2011 – 11/20/2012, we see that our query that was sent to our database contains a WHERE clause requesting only data within this time period.

Another thing to note is that our query is performing a SUM while grouping by OrderDate. This makes sense as we are visualizing the sum of the SalesAmount by day. Lastly, take note of the “TOP (1000001)” that is in the beginning of the SELECT. DirectQuery puts a cap on the number of rows that can be returned by each query. This won’t affect this visualization because, since we are taking the sum, we are only expecting a maximum of one record per day. But keep in mind, you won’t be able to show a visualization if your query returns more than one million records.
But what happens when we have multiple filters? Let’s add a slicer for UnitPrice and find out.
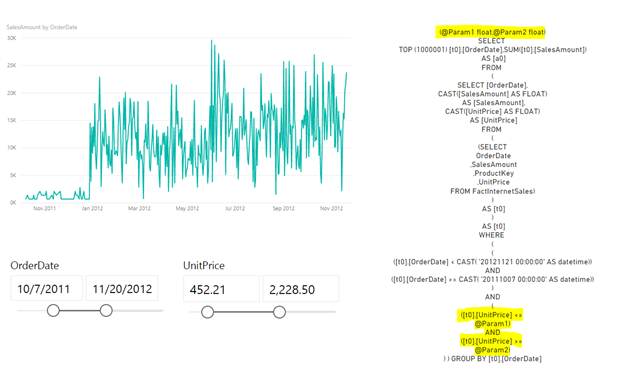
Power BI handles this extra filter by adding a couple of parameters that are appended to the WHERE clause. In this case, @Param1 is the top of the UnitPrice range and @Param2 is the bottom. Let’s wrap up our review by investigating how DirectQuery handles a more complicated DAX measure to calculate a 1-Month Rolling Average using the formula below:
1MonthRollingAverage =
    CALCULATE(
          SUM(Query1[SalesAmount]),
          DATESINPERIOD(Query1[OrderDate], FIRSTDATE(Query1[OrderDate]), -1, MONTH)
    )
      / CALCULATE(
             DISTINCTCOUNT(Query1[OrderDate]),
             DATESINPERIOD(Query1[OrderDate], FIRSTDATE(Query1[OrderDate]), -1, MONTH)
        )
This is not the most well-written measure to accomplish this, but I wanted to show what happens when you introduce a calculation that specifies a row context. As you can see below, you end up with a ridiculous amount of queries…
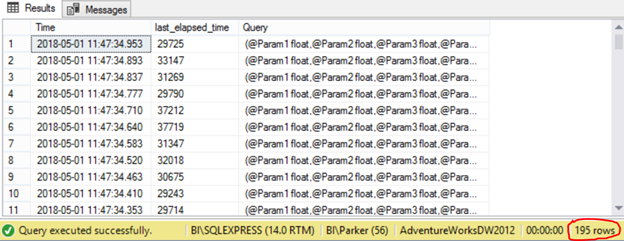
Power BI basically has two options for how it can come up with the result of the calculation. It can either push all of the work to the database as it is doing in this example, or it can query the database only for the raw data and then perform the calculations using DAX. It’s preferred to allow the backend (source database) do all of the heavy lifting, however in this case, that comes at the cost of a large amount of traffic to your data source. Interestingly enough, thanks to the February 2018 Power BI update, DirectQuery is now smart enough to combine additive aggregations such as SUM with non-additive aggregations like DISTINCTCOUNT all in one SQL query. So before this update, we could have expected 390 queries returned!
Conclusion
I hope this post has helped demystify how DirectQuery works behind the scenes. It’s an extremely useful type of connection that can ensure that your data is up-to-date with every selection made on your Power BI report. Just keep in mind that this ability requires the sacrifices of DAX and Power Query limitations and data source traffic. Not to mention, overall speed of report rendering may also take a hit in certain circumstances. With all of this in the open, hopefully you have a strong enough understanding of DirectQuery to decide if it is right or wrong for your report.
I have a companion video that you can view here.
Thank you for your sharing. I am worried that I lack creative ideas. It is your article that makes me full of hope. Thank you. But, I have a question, can you help me?
HI! My pbix files are connected with Sharepoint.Files (“https://xxxxo.sharepoint.com/”, [ApiVersion = 15]) all my files are .CSV files, my own account is Office365Business, when refresh the pbix file spend 20 minutes or more to finish the refresh… my account Office365Business may have another “apps” for storage included, which “app” do you recommend so that refresh are shorter or better or both….Thanks
educative, thanks
Claro el resumen, gracias por el alcance.