I was delivering an advanced DAX class recently and was chatting with the bright students in the class about various topics. Through the discussions it occurred to me that it may be possible to create a compound join between 2 tables using a combination of the inactive relationship feature and the many to many physical relationship feature. I tested it out and it works. The rest of article below explains how to do it and why you may or may not want to do it. It is primarily a learning discussion rather than an article that you will immediately want to learn from and then implement.
I have a few other articles about using relationships that you may like to read. The first is the more common use of Multiple Relationships and I have another explaining how to use TREATAS as a virtual filter.
Before moving on, let me explain the background .
One to Many Relationships and the Star Schema
The standard way to join 2 tables together in Power BI is with a single, active, one to many relationship. Once you have a few tables joined in this way it is referred to as a star schema (example shown in image below).
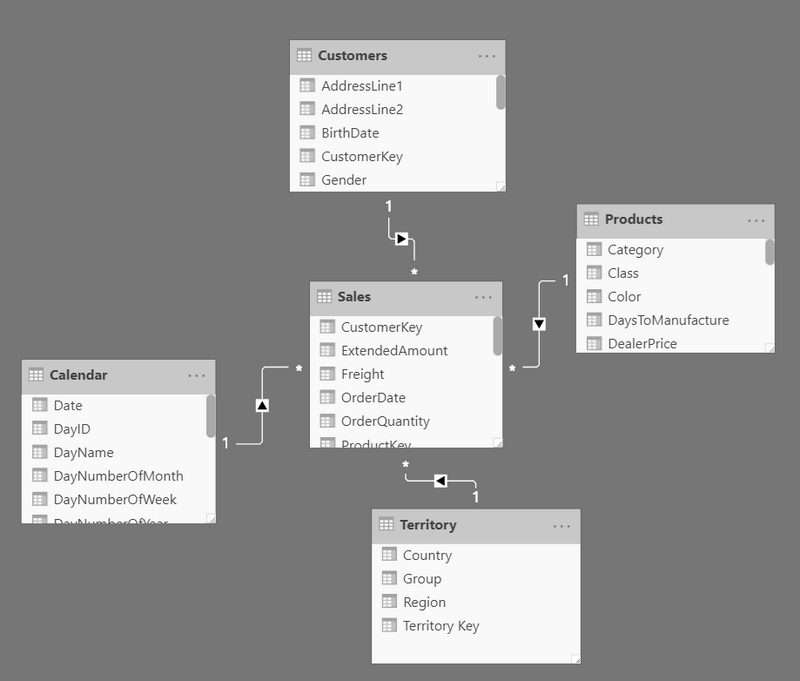
The star schema is the preferred way to load and model data in Power BI. I have a previous article explaining the star schema that you can read if you are interested in more detail. The key point relevant to this article is that one of the tables in this type of relationships must have a primary key i.e, it must contain a column that uniquely identifies each row in the table. Duplicates are not allowed in at least one of the two tables.
Many to Many Relationships
Sometime in 2018 (from memory), Microsoft introduced the ability to create physical many to many relationships in Power BI too.
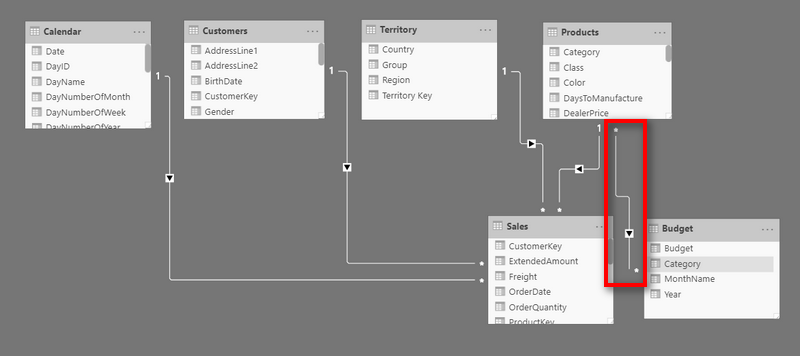
This feature was bundled as part of composite data model capability. Physical many to many relationships is a big topic in its own right and I am not going to cover that in too much detail in this article. The key feature of this relationship type is it allows you to join 2 tables together even if there are repeating values in the join columns in both tables – i.e, it does not require a primary key in one of the columns in one of the tables. A word of warning here – just because you can, doesn’t mean you should.
Joining Tables with 2 Relationships
It has been possible to create multiple 1 to many relationships between 2 tables since the beginning. When you have 2 relationships between tables, at least one of them must be inactive (as shown below). The dotted relationship is inactive.
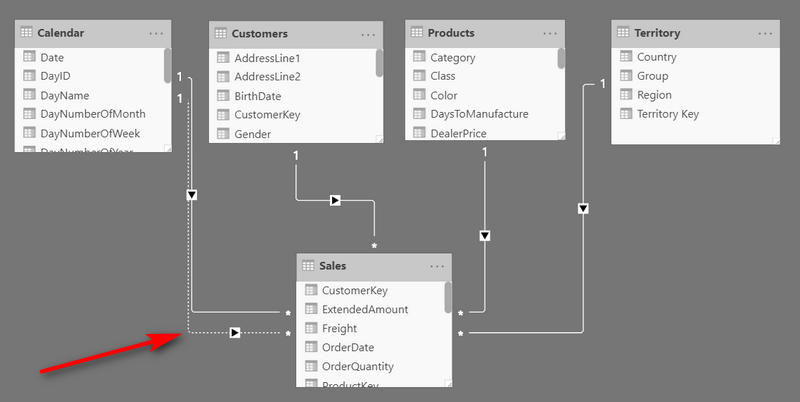
One common use case for such a configuration is when you have 2 dates in your data table (e.g. order date and delivery date) and you want to link both dates to your calendar table for reporting. The inactive relationship can be ‘enabled’ inside a CALCULATE function (in a measure) so you can enable the relationship on demand. You can read more about that in my article about multiple relationships.
Joining 2 Tables with Compound Joins on 2 Columns
OK, so let me show you how to leverage many to many relationships and inactive relationships to create a compound key on two columns between 2 tables. It will make more sense with an example. I am going to use some training data that my mate Ken Puls gave me a few years ago. Below you can see a chart of accounts table that contains a compound key across the AccNumber and AccDept columns.
Chart of Accounts

It is the combination of the AccNumber and the AccDept that uniquely identifies each row in this table. Stated another way, the COA table above does not have a primary key as such but it is the combination of the 2 columns mentioned above that uniquely identify each row.
General Ledger
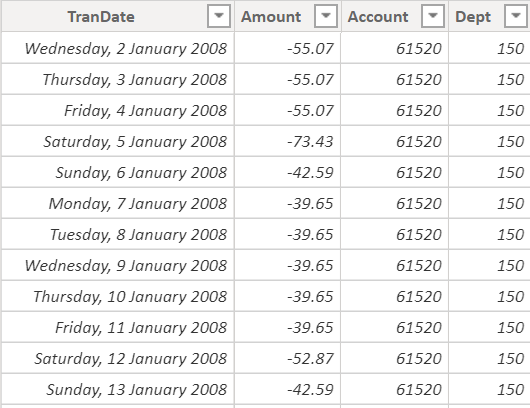
The other table in my demo data is a general ledger extract (see below). Note that this table also has 2 columns (Account and Dept) to map each transaction back to the COA.
The Traditional Solution
The traditional (standard) way to join these tables in Power BI is to create a primary key in the COA table by concatenating the AccNumber and AccDept into a new primary key column, like this.
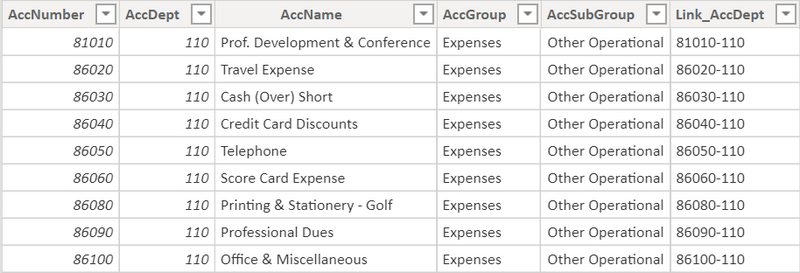
Note the new concatenated column at the end of the table.
The same needs to be done with the GL table. Once the key is created in the GL table, the original 2 columns for account and department can be deleted leaving just the foreign key in the GL table (as shown below).

The Compound Join Solution
As you have probably worked out by now, it is simply a matter of joining the chart of accounts table to the general ledger table with 2 relationships as shown below. They will both be many to many relationships because the chart of accounts lookup table (aka dimension table) contains duplicate values in both columns participating in the join. Because there are 2 relationships, either one or both must be inactive.

When you join the tables, it is important to do 2 things
- Set the cross filter direction so the lookup (dimension) table filters the data (fact table) as shown below (turn off bi-directional filtering).

- Make sure that the columns in the lookup table (dimension table) contain a super set of all records in the data table (fact table).
If you don’t do these 2 things, you are asking for trouble – take my word for it. The reasons why are another of those bigger discussion points that I will leave for another day.
Writing The DAX to Pull it All Together
The final step in the process to leverage this relationship design is to write DAX formulas that will use BOTH relationships at the same time. This is easy and straight forward and involves the USERELATIONSHIP function as shown below.
Total Value =
     CALCULATE(
          SUM(GeneralLedger[Amount]),
          USERELATIONSHIP(ChartOfAccounts[AccDept],GeneralLedger[Dept]),
          USERELATIONSHIP(ChartOfAccounts[AccNumber],GeneralLedger[Account])
      )
The code above explicitly turns on both relationships so they are both active. The filter parameters in CALCULATE operate as a logical AND, hence when there are 2 filter parameters added, they are used in an additive way. It is necessary to add the active relationship as well as the inactive relationship because the default behaviour for USERELATIONSHIP is to turn on the inactive relationship AND deactivate the active relationship. By adding both inside CALCUATE, you get them both applied together.
A Word of Caution
Like many things in DAX and Power BI, just because you can do it, doesn’t mean you should. Many to many relationships are not like one to many relationships. One to many relationships are optimised, materialised and stored in the model. They are designed for highly performant cross filtering between tables. Many to many relationships are not materialised and stored in the model meaning they are generally less efficient and less performant. If you have a small model and it is “fast enough” then of course you can build your model this way.
Unique Values
Generally speaking, the more unique values in a column, the worse the compression will be. By definition, when you concatenate 2 columns together you are significantly increasing the cardinality of the new column (by several orders of magnitude). This has the potential to make your workbooks larger and slower. But you have to weigh that up with the trade off, that many to many relationships are less efficient than 1 to many relationships.
Some Parting Thoughts
Edit: 19 Feb 2020
There has been quite a bit of chatter on twitter from a few people about this post, so I thought I would come back and share my thoughts about why compound joins are not supported directly.
The Power BI storage engine (Vertipaq) is a column store database. It was built from the ground up to be highly optimised for speed of data retrieval, compression and on the fly aggregation. I have always believed that the designers made some architectural decisions and compromises to get the best results, and one of these decisions was to only support a single, 1 to many physical relationship between any two tables (I don’t know this for a fact – I will update this post if I can confirm). This is very different to SQL Server which supports multiple (compound joins) between any two tables. My belief is there is a trade off with compound joins – they can only be supported if there are compromises on the speed of operation. So the original version of Vertipaq only supported 1 to many, single active relationships. Compound joins became possible after the many to many relationship type was introduced in mid 2018.
Which to Use?
I am a big believer in the star schema as the foundation of most good Power BI data models. My default position therefore is to prefer the star schema approach with a single, active relationship between tables. But I am also a believer that you can significantly build your depth of knowledge, skills and super powers by exploring the capabilities of the tool and the DAX language. So with that in mind, I hope you found this article useful in expanding your knowledge.

I don’t think the title of your article matches the content lol. Just kidding, mainly because I had some doubts after reading the article.
How about using TREATAS instead of the inactive many-to-many relationship?
So the second filter could be along the lines of
TREATAS(VALUES(dimtable [column]), facttable[column]).
In effect this is creating a “virtual” one -to-many relationship, isn’t it?
And if the visual contains the dimtable key as a filter context (with the one-to-many) relationship active) it should theoretically work without the first filter expression in your example.
Haven’t actually tried it, however…
Sure, why not. I have an article about TreatAs on my site too. This article was about using 2 relationships at once.
Right, I see. Just thought it was worth mentioning in the context of your final conclusions on the subject and as an(other) alternative…(and it also helps get TREATAS a little exposure to an otherwise fairly unknown function…of the type that many ignore it even exists or may feel intimidated by it. It has also recently become a favourite of mine!)
And I would also argue that TREATAS actually works in this context as having two “relationsips” (albeit being a “virtual” one…)
I have changed the lead in to this article with links and references to the other discussions about relationships, including the one about TREATAS
Nice post – thanks, Matt. I’ll probably stick with concatenation to create the key in Query, but this is a great academic exercise (for learning and also just in case…)!
Yes, me too. 1 to many is the way to go, but this is definitely interesting
Interesting
As you wrote at the end I too believe in star schema and it looks easy to concatenating 2 columns.
I also have the feeling there are more and more options in Power BI that only make more and more users frustrated, with no real value.
Do you see any real significant use for it?
There has been some tweeting about this too. I will update the blog with some parting thoughts from me on the topic to address these comments