Way back in 2019, I was fortunate enough to meet Jeffrey Wang while at the MVP summit in Seattle. Jeffrey is one of the fathers of the DAX language and as such he is a hero of mine. I sat through some presentations and discussions, and Jeffrey mentioned an idea that I thought was just great.
No Auto Aggregations on Dimension Tables
Have you ever loaded a calendar table with lots of numeric columns (such as Year, Month Number, etc), loaded it into Power BI, and then had to manually go an turn off the default aggregation on these columns? If you build Power BI reports, then I bet you have done this more than once. Jeffrey’s idea was that Power BI should be smart enough to detect a dimension table (one side of the relationship) and to disable these default aggregations. There’s nothing worse than adding a Year column to a table and having Power BI add the years together. If I add a year to a table, I want to slice and dice, not SUM the years. This issue mainly occurs with a table visual because it is the one visual where a column can be both aggregated and also used to slice and dice. All other visuals you implicitly choose what behaviour you are after depending where you drag and drop the column. Actually, it’s slightly worse than that. If you select the check box in a column, and the column has an aggregation set, then it will be added to values section of a visual by default. If the default aggregation is set to “do not summarize”, then clicking the checkbox will add it to one of the other data wells in all visuals.
Ideas.PowerBI.com
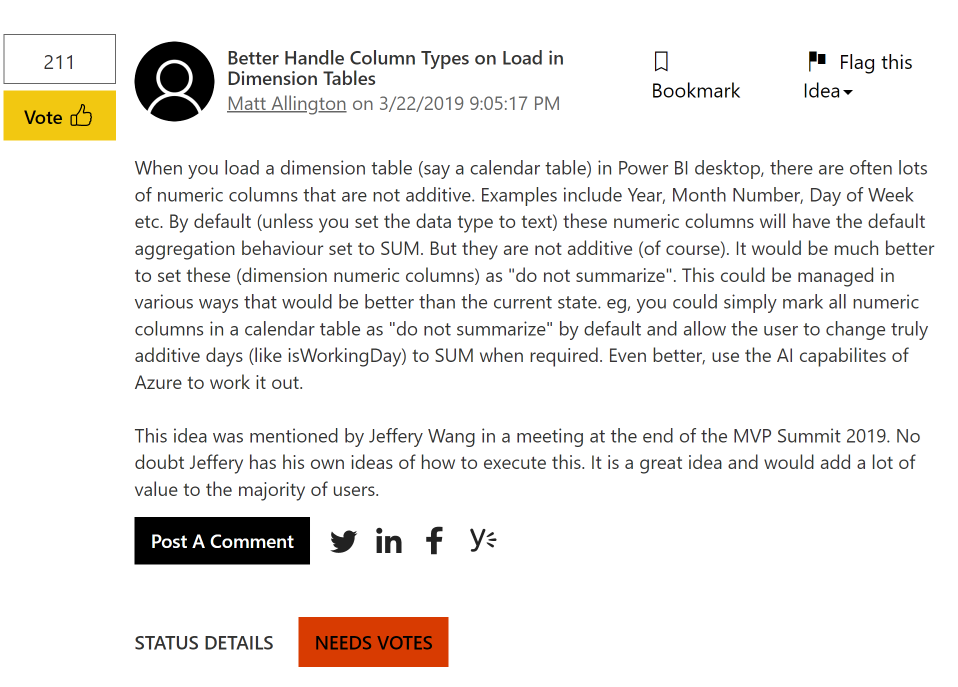
I thought this was a great idea and posted it here. https://ideas.powerbi.com/ideas/idea/?ideaid=614b7df9-b9ef-4702-9188-32e5fc00a201

At this writing, it’s still sitting in the status “needs votes”.
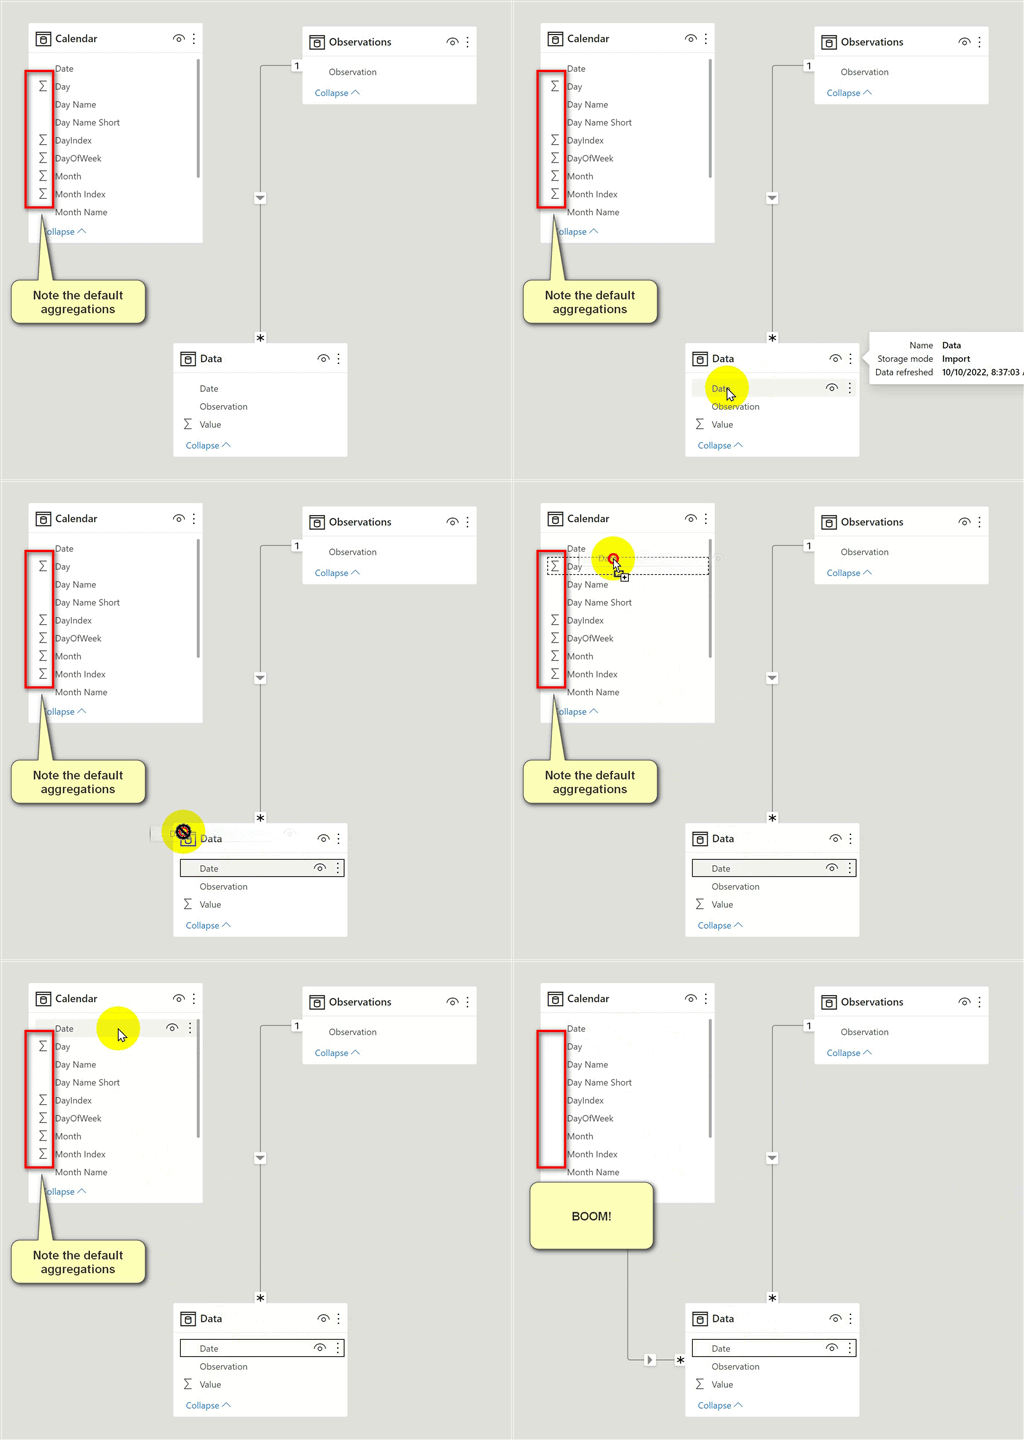
But it looks like it has been delivered!
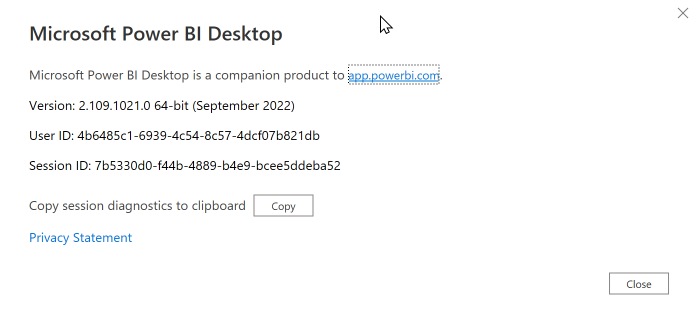
I was just building a report using Power BI Desktop Sept 2022 edition.

And I noticed the following behaviour. It seems this change has been delivered.

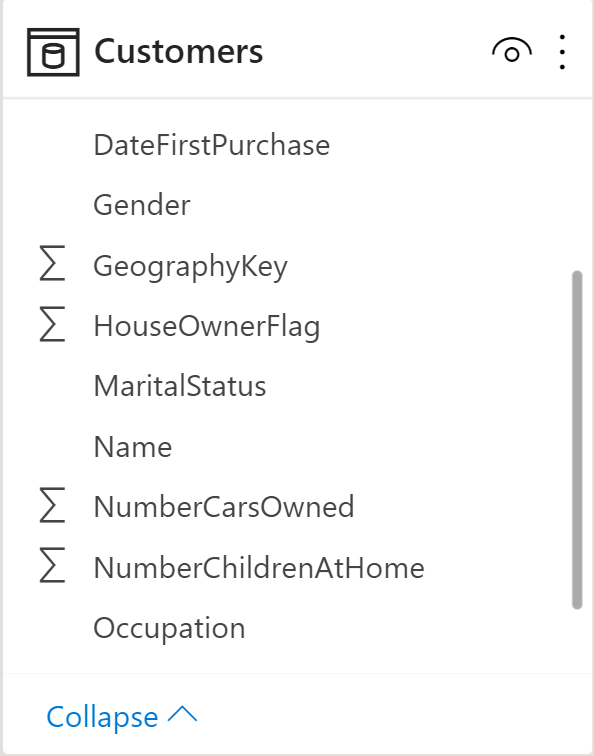
I did a quick test on the Customers table using Adventure Works. The Customers table has a mix of numeric columns that arguably may be better left with a SUM aggregation.

The geography key above is best with aggregations turned off, but the house owner flag, number of cars owned and number of children at home arguably could be left with aggregation turned on. It is not clear cut, and it is not right or wrong. Given my preference to write measures when I want aggregations, turning off auto aggregations on dimension tables is a great feature. What do you think?

Thanks for sharing. I read many of your blog posts, cool, your blog is very good.
Defijitely improvement. I do not like PBI “i know better than you what should be done without your notice” approach.
Thanks for the voting and the wonderful news.
I always prefer explicit measures so this is a great move I believe.
Excellent feature and thank you for sharing that it’s now turned off by default. Will save so much time.