One of the commercial services I offer is to complete a health check of Power BI deployments. I look at everything including the data model, the DAX, the queries, the distribution approach, and other things to help you polish your work. I thought I would share with you one of the great tools that I use when doing such an audit; that is Imke Feldman’s Power BI Cleaner Tool. This tool is unique as it includes metadata about the Visuals used in a report. Once you have this information about all the visuals, you can work out which columns are being used, and therefore which are the unused columns in your Power BI data model.
The Problem with Columns
I have a saying in Power BI. Load every column you need, and nothing that you don’t need. The reason for this advice is that columns can make your data model bigger and less performant. You will of course need some columns in your data model for different purposes. Some are used for defining measures and some are used for slicing, dicing and summarising your data in the various visuals. But it is very common for people to load everything from the source, meaning that some of the columns are likely to be loaded but not used. Once the data model is ready and the reporting is done, it can be beneficial to remove the columns that are not being used and are not likely to be used for ad hoc reporting in the near future. The question is – how do you find unused columns in Power BI? This is where Imke’s Power BI Cleaner tool comes in; I will show you how to use it below.
Here are steps for finding unused columns in your Power BI data model:
- Download the Power BI Cleaner tool
- Save your Power BI workbook as a template File
- Download the VertiPaq Analyzer file
- Load the template file and VertiPaq Analyzer file into the Power BI Cleaner tool
- Identify the unused columns in the data model and delete as desired.
I will walk you through these steps using a copy of my Adventure Works Power BI workbook that I use in my training. This workbook has some measures and quite a few visuals, so it will be good to see what is not being used.
Download the Power BI Cleaner tool
You can download the Power BI Cleaner tool from https://www.thebiccountant.com/2020/01/01/tidy-up-power-bi-models-with-the-power-bi-cleaner-tool/
Have a read of the blog linked above too if you are interested. You will find the download at the bottom of the page as shown below.

Unzip the downloaded file to get the Power BI workbook PowerBICleanerVx_Upload.pbix. This is the tool we are going to use (version 7 at this writing).

Save the Power BI Workbook as a Template File
The cleaner tool accesses the metadata from a template file for the Power BI workbook. To create the template file, open the workbook and then save it as a Power BI template file as shown below.

Download the VertiPaq Analyzer File
The next step is to download the Vertipaq Analyzer file using DAX Studio from within Power BI workbook. Launch DAX Studio by clicking on External Tools tab (#1 below) in the menu and then on DAX Studio (#2 below). If you don’t have DAX Studio or the External Tools tab, read the articles I linked above.

In DAX Studio click on the Advanced tab (#1 below) in the menu and then on Export Metrics (#2 below).

Save the Vertipaq Analyzer file to your folder as shown below.

Now you can close your Power BI workbook.
Identify Unused Columns in the Power BI Data Model
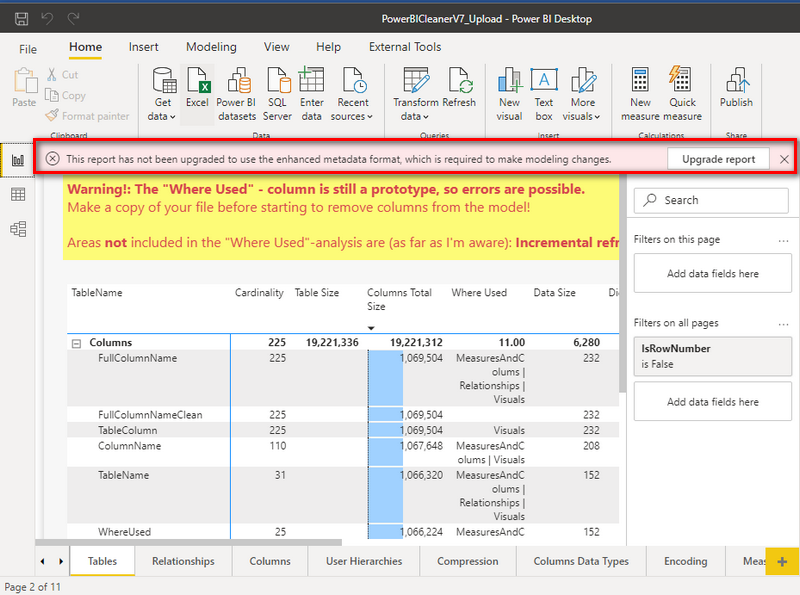
Open the Power BI Cleaner tool workbook. You might see a message as shown depending on how old your workbook is. If you see it you should ignore it and move to the next step.
You need to load the data from the template version of your Power BI workbook and the VertiPaq Analyzer file that you downloaded from DAX Studio into this Power BI Cleaner tool.
Click on Transform data (#1 below) in the menu and then on Edit parameters (#2 below).

Copy the files paths for the PBIT file and the VPAX file as shown below. Note, you need the full path including the file name.

Click on OK and then Refresh the workbook.
The Power BI Cleaner Tool refreshes and loads your data.

After the refresh, take a look at the matrix that comes bundled with the tool. You will see a list of tables and columns that are loaded in your data model. The purpose of this exercise is to find the unused columns in a Power BI data model, so look at the Where Used information (shown as #1 below). This column indicates where each column in your data model is being used, either in measures or visuals. If a column is not used, it will be blank (#2 below). These are the columns that you can delete from your data model to reduce the size and potentially improve the performance of your workbook.

You can filter the matrix shown above to display only the unused columns from all the tables in the data model. To do this, go to the Columns table and find the WhereUsed Column, not the Measure (#1 below). Drag this column to the Filters on this page (#2 below).

Next, under Filters, apply Basic filtering to show only empty values as shown below.

This shows the 41 columns in the data model that are not used.

Which Columns Should Be Removed?
Technically you could remove every column that is not being used, however that will mean that you will limit the ad hoc reporting capabilities of your report, including the ability to use Analyze in Excel and Q&A to build ad hoc reports using the columns. I suggest you focus on the big ones and those that have no material meaning to the data model. This is not just about improving the performance; there are also benefits in simplifying your model. It will be much easier for report writers to use your model if you don’t have columns of data that add no meaning or value to your reports. Remove everything you don’t need. The worst that can happen is you get a request to add it back later.
Your article helped me a lot, is there any more related content? Thanks!
Hi Matt,
This tool looks great. However, I had a small query – will this tool also end up removing the columns which are dormant but are being referenced in other DAX measures?
Also, is there a feature to also identify fully dormant dax measures also? I have a huge report with 100+ DAX measures and since multiple people have worked on it over time, there seems to be a lot of junk. Manual testing will take weeks! Please help.
Thanks in advance,
Abhay
It will only remove columns you allow it to remove. It windows is a column is being referenced in a measure. It also knows which measures are not being used.
Hi! Matt, In report (day or invoice) has +40 columns for each record (day or invoice number), the products are in columns, for better analysis or better performance, please do you recommend/suggest, unpivot the data(report)? if I do this the result is 5 columns with significantly increase the number of rows in my data set (for each invoice number or day), another way a think is create tables for product and has a dimension table for invoice number and client, I if a do this a have huge amount of tables on my data set each table with 4 or 5 columns with same amount of rows from original report, or do you suggest other way?
You should always build a star schema if you can. Read this. https://exceleratorbi.com.au/the-optimal-shape-for-power-pivot-data/
And this
https://exceleratorbi.com.au/calculated-columns-vs-measures-dax/
Yes you should unpivot your columns, but the exact approach depends on your data.
If you want to learn properly how do do this, I have a full training course here https://www.skillwave.training/shop/dimensional-modeling-course/
Thanks, Matt
Hi Matt,
I´ve got those 2 errors when I tried to refresh, do you know waht could be?
FieldUsageDetails
We cannot convert the value null to type Text.
WhereUsed
We cannot convert the value null to type Text.
I found it myself, I had created a RLS pattern without filters, so there was a null value on Roles Section causing the above error while grouping then.
This is insanely useful for those who has a job of enhancing the performance of the Slow Models, Thanks for this tool.
Great job writing this blog Matt.
How can we achieve this great feature in the report only (separated dataset) files? (converted to template)
Do you mean a thin workbook where the data model is in a different workbook? I don’t know. I suggest you try the VPAX file from the file containing the data model and the pbit from the report workbook. Post back how you go.