Have you ever had report consumers that just don’t read your instructions? Well, you’re not alone. Having delivered our Module 1 : Data to Dashboard training for about 4 months now, I have often been challenged during the Drill Through Reports topic, with students commenting
“I’ve tried text based tooltips before, but my users just don’t get it. Unless there is another easy way to trian them, it will just be easier for me to have all the visuals on one page.”
Despite the Power BI development team adding “Right click to drill through” onto the default tooltip of a Drillthrough enabled report, many of us still encounter end-users who just don’t get it.
This is what inspired me to share this simple yet often overlooked alternative to abandoning your report interactivity, and to ensure our dedicated followers were aware of it. The ability to use the Visual Header Tooltip to provide an animated instruction, so your end-users can see how to interact with your reports as you intended.
Below I cover a step by step illustration of how to build an animated tooltip instruction for adding to the Visual Header Tooltip Icon on your report.
I first learned of this technique from Patrick at Guy in a Cube.
To ensure consistency for our readers, I’ll be using our trusty old Adventure Works model to demonstrate.
Current Defaults
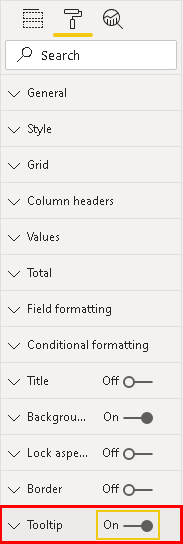
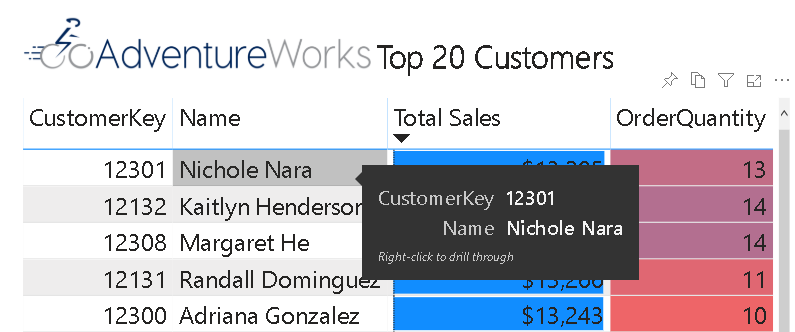
Tooltips on a matrix are off by default. To turn on this feature, simply select your matrix, go to the formatting pane, and turn on ToolTip. Now, when you hover your mouse over an element within the parent visual, the tooltip pops up to reveal the “Right-click to drill through” option.
For most reports this is sufficiently self explanatory, but there may be times when your report is a little more complex or your target audience is unaware of such capabilities. It is in these situations that having an animated demonstration of the intended action can be very useful.
Create the GIF
The first step in authoring the animated help, is to create a GIF file of the process in action. There are many tools on the market that will help you achieve the necessary steps. You can either work with free sites online, or install small programs that will complete the required tasks at hand.
To generate a GIF of the process in action requires two steps.
First you need to get a screen capture video of the process in action
Then you need to convert that video into a GIF file.
To make the screen capture videos and convert them to GIFs for this post, I used Faststone Capture.
Building the ToolTip
Once you have a GIF of your process in action, you’ll need to set it up as an animated tooltip. To do this, create a new page in your report, I called mine Drill Through Help. Set the page up as a Tooltip, then hide it.
If you are unsure how to set your page as a Tooltip, we cover this in our online training module: Building Power BI Reports – Tool Tip Report. We may end up writing a blog on it someday too, or you can simple search online for instructions.
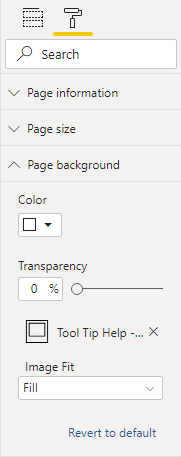
Format your ToolTip page, and insert your GIF into the Page Background by clicking + Add image. Ensure the transparency is set to 0% and fit or fill your GIF to the page as required.
You may also want to add a text box to your tooltip report page as a header for the animation. Something like “Learn how to drill through for more detail”.


Note: It is critical that the GIF is mounted as a page background. This will not work if you insert the GIF as an image onto the page.
Mounting the ToolTip
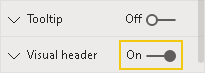
Now that you have an active animated tooltip, you need to mount it to your report so that it makes sense as a help function. Switch back to where the parent visual exists in your report, and select it. On the Visualizations pane, select format, scroll to the bottom and turn on the Visual Header.
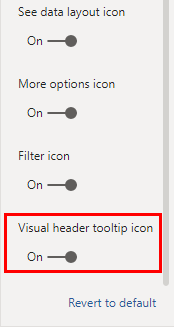
Then expand the new Visual Header menu and scroll to the very bottom of the options, and turn on the Visual header tooltip icon. This adds a small (?) icon to the header section of your visual.
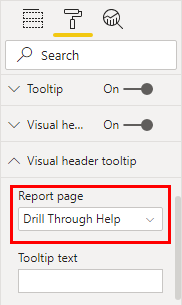
There will also now be another expandable tab in your Visualizations pane, the Visual Header Tooltip. Expand the Visual Header Tooltip, and change Report Page [None] to your animated tooltip page, in this case [Drill Through Help].
The Final Result
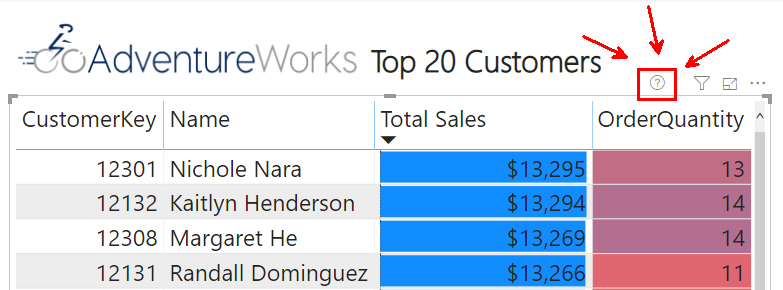
Now, when you hover over the help icon (?) at the top of your report, your animated tooltip will pop into view.
This feature works in both Desktop and the Service.
You can download the example workbook here.
Your ability to simplify complex ideas without diluting their essence is a rare talent. Keep sharing your knowledge with the world.
GIF is not visible when published on the service. We need to add the gif again and save the report on Service everytime it opens.
May I know if I am doing something wrong.
What is the expected size of the GIF expected?
Ideally you want to keep the GIF small. The larger it is, the longer it will take to load in the service, and thus may appear to not be working, when in actual fact it is just suffering a significant lag.
I don’t have a recommended size, but know that large GIFs load slowly. Try creating the GIF from a smaller screen capture.
OMG! How could I miss this video?
It’s an awesome trick!
Thank you very much for sharing!