This is the third article where I have covered building a P&L in Power BI. My first 2 articles here and here focused on how to use the DAX language to solve some of the common problems with P&L reporting, such as adding sub totals into the visual, % of totals, etc. You can read those articles if you are interested. In the article today I will show you how to use the new Info River Financial custom visual to achieve essentially the same outcome without any DAX at all (and I mean none!).
Info River Financial Custom Visual
This custom visual is currently in development by Visual BI. You can visit the Info River Website here and download a beta copy of the custom visual I have used in the video today.
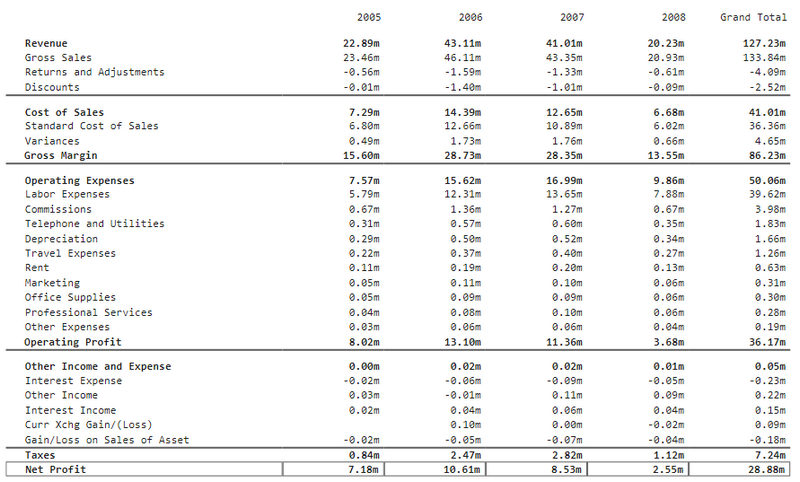
Here is my final P&L Statement
Here is the final copy of the P&L statement I built using Info River Finance – zero DAX.
Demo
The best way for me to show you how to do this is simple to show you in a video, so here is the video.
Pricing and GA
At this stage I do not have any information about the pricing of the InfoRiver Financial custom visual or any of the other 2 visuals that will be coming in the future. The Financial custom visual is currently in Beta, so it is free for you to try. If you think this visual could help you with your Power BI reporting, then why not give it a go.
I’ve read some good stuff here. Definitely worth bookmarking for revisiting. I surprise how much effort you put to make such a wonderful informative site.
Can I just say what a relief to search out somebody who truly is aware of what theyre speaking about on the internet. You undoubtedly know how one can convey a problem to gentle and make it important. More people need to read this and perceive this side of the story. I cant believe youre no more fashionable because you positively have the gift.
Your place is valueble for me. Thanks!…
I like this web site very much, Its a very nice billet to read and find info .
Good site! I truly love how it is easy on my eyes and the data are well written. I am wondering how I could be notified whenever a new post has been made. I have subscribed to your RSS feed which must do the trick! Have a great day!
I cherished as much as you will obtain carried out proper here. The sketch is attractive, your authored material stylish. nevertheless, you command get bought an nervousness over that you want be turning in the following. sick indubitably come further formerly once more since exactly the same nearly very regularly inside of case you defend this increase.
Thanks a bunch for sharing this with all of us you really understand what you’re talking approximately! Bookmarked. Please also talk over with my website =). We may have a link change arrangement between us!
I really appreciate this post. I have been looking everywhere for this! Thank goodness I found it on Bing. You have made my day! Thanks again
I think other site proprietors should take this web site as an model, very clean and excellent user friendly style and design, let alone the content. You are an expert in this topic!
Your article helped me a lot, is there any more related content? Thanks! https://www.binance.com/fr/join?ref=UT2YTZSU
Here’s a comment for **”Build a P\&L in Power BI Without Any DAX”**:
—
“Creating a Profit & Loss statement in Power BI without using DAX is a game-changer for users who prefer a no-code approach. This method simplifies financial reporting and makes Power BI more accessible to finance professionals with limited technical background.”
You can certainly see your enthusiasm in the work you write. The world hopes for more passionate writers such as you who aren’t afraid to mention how they believe. Always go after your heart.
You made some respectable factors there. I appeared on the internet for the issue and found most people will associate with with your website.
me encantei com este site. Para saber mais detalhes acesse o site e descubra mais. Todas as informações contidas são informações relevantes e exclusivas. Tudo que você precisa saber está está lá.
Very interesting information!Perfect just what I was searching for! “People everywhere confuse what they read in newspapers with news.” by A. J. Liebling.
Very interesting information!Perfect just what I was searching for!
Howdy! I’m at work browsing your blog from my new iphone! Just wanted to say I love reading through your blog and look forward to all your posts! Carry on the great work!
Enjoyed looking through this, very good stuff, regards.
I have been browsing online greater than 3 hours as of late, but I by no means discovered any attention-grabbing article like yours. It is beautiful value enough for me. Personally, if all website owners and bloggers made excellent content material as you probably did, the internet will be much more useful than ever before.
Hiya! I know this is kinda off topic however , I’d figured I’d ask. Would you be interested in trading links or maybe guest writing a blog post or vice-versa? My blog goes over a lot of the same subjects as yours and I think we could greatly benefit from each other. If you happen to be interested feel free to send me an email. I look forward to hearing from you! Superb blog by the way!
I do love the manner in which you have framed this specific matter and it does offer me a lot of fodder for consideration. Nonetheless, through just what I have seen, I only hope as other commentary stack on that people remain on point and in no way embark on a tirade associated with some other news du jour. All the same, thank you for this exceptional point and whilst I can not agree with this in totality, I regard your viewpoint.
Your point of view caught my eye and was very interesting. Thanks. I have a question for you. https://accounts.binance.com/ES_la/register-person?ref=T7KCZASX
Here and there new visuals come out for making the P&L’s, balance sheets etc. I’m just thinking that costs can get pretty expensive when each user needs a license. PBI license €8,70/month, but some custom visuals charge €5,00/month. When you compare it to the regular license, it’s sounds like an expensive deal.
What’s your take on this Matt?
This is such an important point, and I agree with you. I think ultimately you (the customer) need to clarify the value you are receiving and the software vendor needs to work out how to charge you a fair price. The more value it adds, the more it is worth paying for the software. But it is complicated, because Power BI is basically a per user licence/fee and not every user gets the same value. The person that builds the report using this custom visual will get enormous value in time savings, but the end user may not see any value at all – they just see the same report they would have seen if the report builder took 100 hours more effort.
I don’t have an answer on this one, but it is definitely the right question to ask.
That sure would have been handy a few years ago LOL, although my full DAX version still getting it done. Nicely done!
Another option for no DAX financial reporting that also includes visualization according to IBCS, commenting and write-back/planning: https://www.acterys.com/financial-reporting-in-power-bi/
Hi Matt
Thanks for sharing this. Readers would also be interested in the Zebra BI custom visuals which can do all this and much more. Sure you will have to pay for them – and you should! For IBCS compliant enterprise financial reporting with automatic variance analysis look no further. Income statement, Balance sheet, Cashflow – anything that involves intermediate calculations. It has cut my development time for complex client projects by about 80%.
Thanks again for all your great work.
Tony maclaren
Totally agree. The Zebra BI visuals are great.
Hello Tony, Inforiver as a product is 100% IBCS compliant and Certified. When you take a look at the Business Edition (https://inforiver.com/editions/) that will get revealed at our June 03 Webinar (https://inforiver.com/webinars/) – you will realize that Inforiver is the fastest way to create any IBCS standard reports (in fact less than 1 minute for any table templates) with nothing to click or setup (fully automatic).
Very clever visual! Thanks Matt. I wonder whether they are also planning to do a similar visual for Balance Sheet & Cash Flow to make it easy to produce a full 3-way financial model in PBI
As I mentioned in the video, I am helping the company with some testing including the other 2 products that are being developed. These will be launched in beta in June. I can’t say too much, but they are pretty amazing products.
Keep us posted, ive build w3 way models in Excel but PowerBI would be the Ultimate for me, very exciting.