One of the things I like about my live, online training courses is that I get to hear great questions from the trenches from people learning DAX and Power BI. Last week, John asked me how to apply conditional formatting with a Text field (not a numeric field). I knew it could be done, but it required some brief research before I could give an answer. It is pretty easy to apply conditional formatting on a numeric field – this feature was added to Power BI some time back. However, Microsoft has also added the ability to apply conditional formatting to a Text field too in some circumstances.
Example
To understand the process of configuring this, consider the following simple data table:
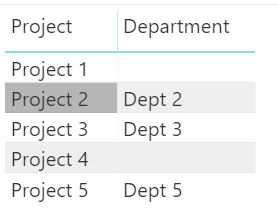
I just entered some simple sample data using the “Enter Data” menu option. As you can see Project 2, Project 3 and Project 5 have departments associated with them while Project 1 and Project 4 do not.
Suppose you want to use conditional formatting to highlight (colour code) which of the Projects have Departments associated with them and which do not.
The Method
The high level process is to:
- Create a measure that returns a colour as the result
- It can be a word, such as blue, red, green
- It can be a hex code for a colour, like #40E0D0″, “#FFA07A”
- Use conditional formatting and use the measure to apply the formatting on the text as a rule.
Here is the step-by-step process explained.
To start with, I created a test measure as follows.
Test =
     VAR Dept = SELECTEDVALUE(Projects[Department])
     RETURN IF(Dept <> BLANK(), Dept, "No Dept")
Next, I placed a table visual in the report and added the columns project, department and the test measure.
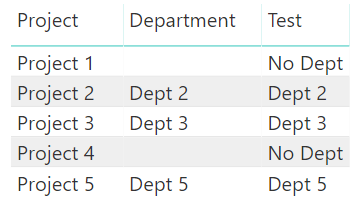
As you can see, the measure identifies which of the projects have a department and which do not. So this test measure has the logic required to go to the next step.
Next, I created a new measure [Colour Project], taking the logic from the test measure that I created above and modifying it to output names of colours. This can be simply achieved by returning hex codes or common names of colours.
Colour Project =
    VAR Dept = SELECTEDVALUE(Projects[Department])
    RETURN IF(Dept <> BLANK(), "#40E0D0", "#FFA07A")
The next step is to turn on the conditional formatting for the project column so that it is coloured based on the measure [Colour Project] above.
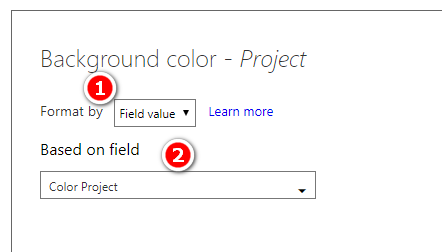
To apply the conditional formatting, I clicked on the down arrow (#1 below) next to project and then on conditional formatting (#2 below) and then on background color (#3 below).

In the background color dialog that appears, select format by field value (#1 below) and based on field color project (#2 below). Click on OK.
The text field “project” is now conditionally formatted by the logic given by the measure [Colour Project] using the chosen Hex Codes.

It is also possible to apply conditional formatting using words, such as “Green” and “Red”.
To illustrate this, I created the measure [Colour Test] based on the logic previously used as follows.
Colour Test =
    VAR Dept = SELECTEDVALUE(Projects[Department])
    RETURN IF(Dept <> BLANK(), "Green", "Red")

Next, I applied the conditional formatting on the original measure [Test] using font color. I used format by color test. And the result is as follows.

Final Thoughts on Conditional Formatting with a Text Field
It is worth noting that I am using the table visual for this article. All columns and measures are placed in the Values section of the visual. Conditional formatting works only when a column or measure is in the Values section of a visual. If we use a matrix instead and place project on rows, you cannot apply conditional formatting to that field.
Good post however I was wondering if you could write a litte
more on this topic? I’d be very grateful
if you could elaborate a little bit further. Many thanks!
Greetings to all our aquatic tranquility hobbyists!
There’s absolutely nothing really like plunging into a hot hot tub after a tiring day. For those in search of the ultimate relaxation experience, a jacuzzi is truly incomparable.
Assortment is truly the spice of living, and we truly pride ourselves on offering a diverse array of whirlpools to meet every desire.
Superiority, to us, is more than a mere word. It’s our standard. All of our products are subjected to intense testing to ensure they consistently provide the best meditation experience for many years to come.
Our well-informed staff is always on hand to direct you in locating the best-suited spa for your needs and residence.
Have you ever thought about having your own personal peace haven? Everything are your wishes when it comes to choosing the ideal hot tub? Let’s talk relating to this!
Keep lively and chilled! Anyhow, I made my own cutting edge company web-page just now, one can view here: Comparing top jacuzzi brands for relaxation Mesa Az
naturally like your web site however you need to take a look at the spelling on several of your posts. A number of them are rife with spelling problems and I find it very bothersome to tell the truth on the other hand I will surely come again again.
Hello to all our peaceful aqua partisans!
There’s absolutely nothing quite like sinking into a steaming whirlpool after a stressful day. For those in search of the absolute serenity experience, a spa is truly unmatched.
Variety is indeed the spice of daily life, and we sincerely pride ourselves on offering a vast selection of hot tubs to cater to every whim.
Quality, to us, is not just a mere word. It’s our benchmark. Each of our products experience thorough testing to ensure they repeatedly provide the optimum relaxation experience for several years to come.
Our well-informed staff is always on hand to assist you in finding the best-suited spa for your needs and lifestyle.
Have you ever dreamed of having your very own meditation haven? Everything are your preferences when it involves choosing the best spa? Let’s converse concerning this!
Continue to be lively and calm! Incidentally, I made my very own creative startup web site just now, one can check out it here: Exclusive hot tub cover deals Paradise Valley AZ
Matt, when I do this in a matrix table of values, I get the error “Cannot convert value ‘Green’ of type Text to type Numeric/Date’
Sounds like an error in a measure somewhere, maybe a conditional formatting measure, or something like that.
Hi Matt. I have numerous columns with text values and would like to apply colors based on the text value on each cell? Each column headers are Period (Jan, Feb etc.) and it measures each row based on performance (OK, Fail, Pending…etc). How do I apply your sample to each columns? Do I have to create new columns and apply each column to each of the Period? Or, is there a way to create just one new column with a dax calc to associate the color for each text value? And then use conditional formatting on each Source column to refer to the new column with dax calc?
Conditional formatting works across columns for a single measure, or simply across a single column. It’s not clear to me how you are visualising this data, so it’s hard to say. If your row is a measure, you should be able to conditionally format it for all columns.
You could also look at the Inforiver custom visual. This has a lot of powerful conditional formatting features. There is a fee for this product
Neat & Clean. Congrats
Hi Matt,
Is there any way to do conditional formatting based on a text field without using DAX?
There is a rules based option. You would have to test it on text. I assume it works, but you wouldn’t be able to format text based on some other numeric field, only the text field itself.
Hi Matt,
I attempted this with the background color, and it worked(!), but only for a single row of the column sets applied to. Is there a way to have it apply to each of the fields that meet the criteria?
I think so. You just need to apply the same formatting to each measure/column in the visual.
Hi Matt,
Thank you for your post! This is definitely helpful! Just wondering instead of change the color of text, is there anyway that we can change font (bold, italic, underline etc.)?
Thanks in advance!
Not to my knowledge, sorry
Hola Quisiera saber si se puede condicionar los colores de un objeto de grafica de series
Hi Matt, I tried to change font colours in columns it’s working. But if it is in red colour I need that font in bold or another is it posiible.
You cannot control things like bold, italics using DAX, unfortunately
Hi, I want to highlight a row named cases, I am trying to follow these steps but its not giving me expected results.
Hi I want to set “Property Status :” text in red color and the remaining string in black color
My output would be something like
PropertyStatus : Active
I am trying to concatenate two strings where in “Property Status :” is a default value in PS variable
DispPScard =
VAR PS = “Property Status :”
VAR Category = SELECTEDVALUE(FM_PRPTY_LIST_RE[FullAddress],”ALL”)
RETURN CONCATENATE(PS,SWITCH(Category,
“ALL”, “NA”,MIN( FM_PRPTY_LIST_RE[Property Status])
) )
You cannot conditionally format part of a text string. You could create 2 text strings and visually lay them out next to each other.
I have been racking my limited knowledge on how I can create a single DAX statement in a measure that will address a series of columns with similar values.
I have say 5 columns (C01D01, C01D02, C01D03, C01D04 & C01D05) … each could display at text field in any given row and I want to conditionally set background colour for a specfic word. What I have so far is:
**
COLOUR CODE =
VAR Colour01 = SELECTEDVALUE(‘OPERATIONS AMC PLAN'[C01D01])
RETURN IF(Colour01 = BLANK(), “”,IF(Colour01 = “DEPOSITION”, “#FF0000”, “#008000”))
**
But I can seem to see how to include the other columns in this statement … is it possible??
Please??
I’m almost positive you are approaching this the wrong way. I don’t know your data or what you are trying to do, but I suggest you at least consider unpivoting all those columns into an attribute and value column using Power Query. If you do that, you don’t have any other columns to include, just the one column.
I hope that makes sense.
Just tried but I can’t choose a measure in Based on field, PBI lets me only choose table columns.
Any measure that meets the requirements for will be available to select. If it is not available, there must be something wrong with the measure. From memory, it has to be text
Is there any way to highlight certain words (interest words) in a text column of a table?
Try the word cloud custom visual, maybe. Or extract the interesting words into a fact table for use and highlighting
Thanks for the detailed steps. This works perfectly fine for my case.
The big question is how to do it with the Matrix
Thank you very much Matt for your guidance.
As always, perfectly explained in a way that everyone could understand.
Hi Matt, I followed same solution in my project but unfortunately it is not giving me the expected result. I have a Card visual in which I am trying to apply this. Can you please help us with a solution get the same thing on Card Visual.
I can’t help with this level of information. What does “not giving me the expected result” mean? You can format the text or the background with a card, but a card does not have a filter context coming from rows like a table. You need to check what SELECTEDVALUE() returns in the context of your card – you will probably find the answer there.
I have a column that has Yes or No answers- Can you format a single card to a green background if its yes and red background if its no?
Yes. Just follow the same technique in this article.
Great idea. Big thanks..
But I was thinking that it would highlight with colors only when selected. But in the example above it highlights with colors regardless of any selection.
Can you please clarify?
Conditional formatting works on visible cells. I don’t know what you mean by “only when selected”.
How can I apply conditional formatting when I do have a Dimension table with Status and it’s color column and I have to apply conditional formatting by mapping the status column to get the corresponding color. Basically get the color values dynamically instead of providing it in the measure.
I depends where the colours are stored. You could use LOOKUPVALUE() to fetch the text from the table, I guess – I have never done it
Yes, That already worked for me but the issue arises when I use 2 of such columns for generating a third overall status measure.
M1 =
var a = SELECTEDVALUE(T1[Status1])
return LOOKUPVALUE( Mapping[Color], Mapping[RawStatus], a )
M2 =
var b = SELECTEDVALUE(T1[Status2])
return LOOKUPVALUE( Mapping[Color], Mapping[RawStatus], a )
M3 = if (OR([M1] = “Red”, [M2] = “Red”),”Red”,”Green”)
The M1, M2 is working fine. Everything is okay until I pull M3 into my table visual. When M3 is pulled over, the already applied filters will be inactive on my table visual and I am getting more rows in the visual which are not expected.
The Mapping table looks like this:
Category RawStatus Color
———- ———— —–
S1 xxx Red
S1 yyy Green
S2 aaa Red
S2 bbb Green
This is too hard to debug conceptually. You need to chip away at it one step at a time until you work out what is wrong. Maybe expand M3 to include the underlying code for M1 and M2. Put them all in a visual and modify M3 one step at a time to try to nut it out
Your site is great, I started using Power BI at the end of August to address some bad reporting inputs I was getting, now everyday I spend time develping a better way to view the data, or sub-set of the data.
I am looking to hilight rows in a table when the EVidence Status is “verified” using the method shared, but i dont know how to pboelm solve based on the error message provied, it really doesn’t help me.
Colour Evidence Status =
VAR Evidence.Status = SELECTEDVALUE(‘Import-Collection & Testing (1150)'[Evidence Status])
RETURN IF(Evidence.Status = “Verified”, “#7E929F”, “#E1E8F6”)
is returning
The syntax for ‘.’ is incorrect. (DAX( VAR Evidence.Status = SELECTEDVALUE(‘Import-Collection & Testing (1150)'[Evidence Status]) RETURN IF(Evidence.Status = “Verified”, “#7E929F”, “#E1E8F6”))).
Lost in the winderness. THANKS
Try replacing Evidence.Status with EvidenceStatus or Evidence_Status.
That should resolve your issue.
Do we have option to put 5 color base on status, in similar manner as example mention 2 color
Delivered
In-Transit
Shipped
RTO
Pending-Status
Thanks in advance..
Excellent Info. I was able to use a nested IF to allow for multiple TRUE variables. Thank you so much!!!
Test =
VAR Dept = SELECTEDVALUE(Table2[Project](Table2[Department])
RETURN IF(Dept BLANK(), Dept, “No Dept”)
It is showing an error to me while writing the above measure. Can you please help?
Selected value has 2 columns included. Selectedvalue only accepts a single column
Test =
VAR Dept = SELECTEDVALUE(Table2[Project](Table2[Department])
RETURN IF(Dept BLANK(), Dept, “No Dept”)
I have start date and end date.
Have taken 1 date filter which shows list of months.
And based on selected month I added measure for calculating date difference in days.
Now I want to calculate sum of that measure which shows days. So how can I do that ?
Can you please help.me out with that ?
the best place to ask for support is at community.powerbi.com
Hi Matt, I have one column in which I am showing the comparison between the other two column as in if that two columns have same value then new column will show ‘yes’ otherwise ‘no’
I have to apply conditional formatting on this column if its value is yes then background should be red if no then white
How can I do it ?
Thanks ,
First write a measure that defines the colour as follows:
Column3 Colour = VAR SelectedValue = SELECTEDVALUE(‘Table (2)'[Column3])
VAR Colour = SWITCH(SelectedValue,
“Yes”, “Red”,
“No”, “White”
)
RETURN Colour
Next apply conditional formatting on Column3 based on Field Value and choose the field as measure defined above.
Hi Matt, This is excellent, But I am trying to apply color in same column on 2 values. Can you please share your expert advise how this can be possible?
Column
======
Val 1
Val 2
I want Val 1 in color red if occur in column and Val 2 in color green if occur in column.
Thanks,
Define a measure as follows:
Column Colour = VAR SelectedValue = SELECTEDVALUE(‘Table'[Column])
VAR Colour = SWITCH(SelectedValue,
“Val1”, “Red”,
“Val2”, “Green”
)
RETURN Colour
Next, put Column in a Table visual.
Apply conditional formatting for Column by Field value and then choose Column Colour
Matt, thanks a lot for your great help on this issue!
Francesco dell’Oglio!
What about both setting the background color and *font* color, can that be done?
Yes, both the background and the font can be set to the same colour using the same measure. I do this all the time to generate “heat maps” where you just see the colour, not the numbers
Hi Everyone, Is there any way to apply conditional formatting on all columns of table at once, rather than applying on every single column separately?
Not that I am aware of
hello, first thanks for your great tutorial. I’ve got an issue expecting a solution. In a matrix visual, how to conditionally format a subcategory in row? Like change its background Color. It seems that BI only support column and value’s conditional formatting… Hope you can help me.
Thanks!
I would like to know how I should proceed with Power BI when granting access permissions to different users of my company so they can see a report that I make. thank you
It depends what you want to do. In short, you should publish to a workspace and then create an App. If you need more control over who sees what, then look into RLS as covered here https://gqbi.wordpress.com/2016/10/03/power-bi-dynamic-row-level-security-things-you-need-to-know-to-get-it-working/
OH! TAHNK YOU SO MUCH
I would like to ask if POWER BI allows you to make a Conditional Format, in which the conditioners are a value> or = instead of a value, something type
=Switch(E2>=0,8;”text1″; “text2”)
Yes, it is possible to conditionally format with the value >, < or = instead of the value. For e.g. suppose we have another column in the table showing budget for each project. You can conditionally format Project by checking the Budget as follows.
Color Project by Budget =
VAR ProjBudget = SELECTEDVALUE(Projects[Budget])
Return IF(ProjBudget < 1500, "yellow", "pink")
thanks so much
How about highliting the whole line ?
There is currently no way to reference a line in a visual for conditional formatting purposes. This may change – MS is working on expression based formatting across the product. You can already colour the background of a card using an expression (for example). The only option you have is to format each column in the row using the technique I have demonstrated above
OK, thanks !
Very helpful, thanks
Cool trick, Matt.
This is very nice!
Can you apply this on a Matrix?
I have a lot of formating needs on tables!
As I said in the final note, you can’t format the rows on a Matrix.
I miss this!
Thanks Matt!
Actually, yes. You also can use that in matrix. You can use that in “Conditional formatting”.
Very useful tips.