Level: Intermediate
I helped a member at http://powerpivotforum.com.au with a problem last week that ended with an interesting solution. The explanation of how it worked was a bit complicated and worthy of sharing, hence this is the topic of today’s post.
Count the Working Days Between Two Dates
The requirement was to count the working days between the arrival date (say of a request) and the approval date of that request.
I set up a simple data model as follows
Data Table
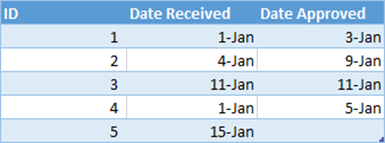
The data table has a unique identifier (ID), a received date and a approved date.

Calendar Table
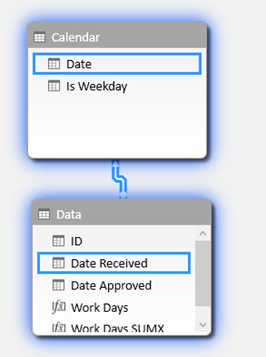
I created a simple calendar table that has just 2 columns; a Dates column and a flag to indicate if each date is a working day. I used 0s and 1s in this second column so that it would be easy to add up this column to calculate the total working days.

Table Structure
I then created a single join between the calendar date and the received date. Technically I could have created the join on the Date Approved column as an alternative, however it is possible (even likely) that some requests will be “open” and hence will not have an Approved Date at some point in time. For this reason I have used the Date Received column to make the join.

Calculated Column or Measure?
There are many ways to write a formula that will work. Of course it is possible to write a calculated column in the data table that contains the total business days for each request. This would not be a complete disaster in this case as the cardinality of this column is likely to be relatively low. However this is not the best approach for a number of other reasons, the main one being that “Measures” are the turbo charged super tools of Power Pivot (read all the reasons here). You should invest time to learn how to write Measures, even (especially) when it is hard. In doing so you will build your skills and depth of understanding of how to use and leverage Power Pivot.
If you laze about in calculated columns world, you will never develop your skills enough to be really good at DAX.
Part Solution: A Simple SUM Measure
The first part of the Measure I wrote to solve this problem is as follows:
= CALCULATE(
     SUM(Calendar[Is Weekday]),
     FILTER(
          ALL('Calendar'),
          'Calendar'[Date] >= MAX(Data[Date Received])
               && 'Calendar'[Date] <= MAX(Data[Date Approved])
     )
)
When reading a CALCULATE formula, you always start with the second parameter – in this case the FILTER function (lines 3 through 7). Filter is an iterator, and in this case it is iterating over the CALENDAR table AFTER any existing filters on the Calendar table are first removed (line 4).
FILTER works through each row in the Calendar table and checks to see if the date of each row in the Calendar table is greater than the maximum Date Received (in the current filter context) and also if that date is less than the maximum Date Approved (also in the current filter context). The FILTER function keeps the rows in the Calendar table that pass this test, and then CALCULATE (line 1) applies this FILTER prior to adding up the week days (line 2). Actually, This FILTER function is not very efficient – a better solution is provided below.
It is easier to understand how the formula works with an example, so read on.
Worked Through Example in a Pivot Table
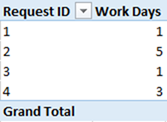
Look at Request ID 2 in the pivot table below (the second row in the pivot). Pivot tables naturally provide initial filter context to the data model – that’s what they do; that’s why they are so great.

When looking at Request ID 2 in the above pivot table, the data model has an initial filter context so that only a single row in the Data table is “visible”. It is possible to simulate this initial filter context into the Data table by physically applying a filter to the source table (like shown below ID = 2). You can do this in the Power Pivot window, or in this case I have used the linked table in Excel to simulate the filter as shown below.

When you simulate the initial filter context like this, it is much easier to understand how the formula works. Referring back to the formula (lines 6 and 7), you need to ask yourself “What is the MAX value of Date Received in the current filter context?”. The answer is clearly 4th Jan and the maximum of Date Approved in the current filter context is 9th Jan. Once you know the answer to the MAX parts of this FILTER function (lines 6 & 7), it is then a lot easier to understand what the FILTER function is actually doing. Remember line 5 of the formula first removes all filters on the Calendar[Date] column (in this example there actually are no filters on the calendar table as there are no columns from Calendar in the pivot). Then FILTER checks each row of the Calendar table to see if the date in each row is >= 4th Jan and also <= 9th Jan. FILTER keeps all rows in the Calendar table that pass this test. Note I could have used MAX or MIN or even VALUES to “harvest” the value in the current filter context. In some cases you can even use SUM or AVERAGE – it really depends on your data and what you are trying to do. In short, the Aggregation functions and VALUES when used this way will “harvest” the value in the current filter context – very useful.
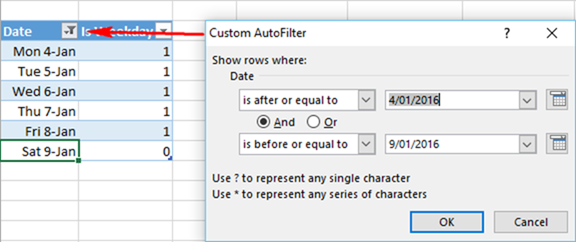
It is possible to simulate the results of this FILTER function on the Calendar table the same way as I showed with the Data table above. In the image below, note how I have used the standard Excel table filter feature to simulate the FILTER function in DAX. After applying the filters in Excel, there are 6 rows left in the table, and 5 of those rows have an “IS Weekday” value of 1.

So when SUM in the formula kicks in, it will return the value 5 – exactly the value shown in the pivot table above.
Note how much easier it is to understand and learn how these functions work when you simulate what is happening in the actual tables? This is a great way to learn to “think in tables”.
The First Problem with this Partial Formula
You may have noticed that there is a problem with the partial formula shown above. Referring back to the pivot table (shown here again), see how the Grand Total row is blank?

What is really needed is for the Grand Total row to be the sum of the values shown in the rows in the pivot table ie the Grand Total should be 10. To understand why the Grand Total it is blank, you have to go through the same process I walked through above. In short, the initial filter context of the Grand Total in the pivot table is “completely un-filtered”. So MAX of Date Received is 15th Jan and MAX of Date Approved is 11th Jan. If you go ahead and simulate this by applying these filters onto the Excel Calendar table (like before), there are no rows in the Calendar table that pass the test. The Calendar table is therefore completely filtered of all rows – none is visible, and hence the SUM formula returns BLANK (note it is BLANK, not 0).
A More Complete SUMX Solution (Still Not Optimal)
Whenever you get this “Grand Totals don’t add up” problem, you should think of SUMX as the solution. I like to think of SUMX as a way to “simulate the natural filtering behaviour provided by the rows of the pivot table”. Each row of the pivot table is providing initial filter context for one record in the Data table and hence the formula works on row level. But no such Data table filtering is provided by the Grand Total row and hence the formula doesn’t work on Grand Total level. I cover this SUM vs SUMX behaviour in more depth in a blog post here.
Here is a formula that you may think should work, but it actually doesn’t work at all.
Work Days SUMX Wrong =
           SUMX(Data,
           CALCULATE(
                    SUM('Calendar'[Is Weekday]),
                    FILTER(
                         ALL('Calendar'),
                         'Calendar'[Date] >= MAX(Data[Date Received])
                              && 'Calendar'[Date] <= MAX(Data[Date Approved])
                    )
               )
          )
In the above formula, SUMX iterates over the Data table (line 2). For each row in the Data table, the formula lines 3 through 10 are executed. Intermediate DAX users can be forgiven for thinking that Context Transition occurs because of the CALCULATE function on line 3 – but in this case it does not happen. Remember earlier in the post I explained that the second parameter of CALCULATE is the first part of the formula to be executed. So in the above formula, the FILTER portion (lines 5 through 9) is executed in the initial filter context without any context transition. The CALCULATE isn’t executed until after the FILTER portion is complete. That is why CALCULATE in this case does not force Context Transition and that is why this formula doesn’t work.
Here is a formula that does work (Still Not Optimal)
Work Days SUMX=
     SUMX(Data,
          CALCULATE(
              CALCULATE(
                   SUM('Calendar'[Is Weekday]),
                   FILTER(
                       ALL('Calendar'),
                      'Calendar'[Date] >= MAX(Data[Date Received])
                          && 'Calendar'[Date] <= MAX(Data[Date Approved])
                   )
              )
         )
     )
Note above in this new correct formula the addition of a second CALCULATE on line 4. The CALCULATE function (ending on line 12) only has a single parameter (which is the second CALCULATE from line 4 through 11). Because the inner CALCULATE function is the first parameter of the outer CALCULATE, the outer CALCULATE is executed first (note if the inner CALCULATE was the second parameter of the outer CALCULATE, then the inner CALCULATE would be executed first – confusing, hey!). The outer CALCULATE forces context transition onto the Data table for every iteration step in the SUMX function before the inner CALCULATE is executed. This context transition is in effect “simulating” the row by row behaviour of the original pivot table regardless if there is an ID used in the filter context or not. This is why it works at the Grand Total level too.

The Optimal SUMX Formula
I mentioned above that the previous formulas are not optimal. The issue is that the Vertipaq engine in Power Pivot is a Columnar Data Store. That means data is compressed and stored in Columns – not Tables. The most efficient way to access the compressed data is one column at a time. In the formulas above, the FILTER function is operating over 2 separate columns in the same table – this is not optimal – in fact it can be very inefficient on large tables. In order for FILTER to do the comparison on 2 separate columns in the same table, Power Pivot needs to decompress the data – this is slow and inefficient.
So a better formula is this.
Work Days SUMX=
     SUMX(Data,
          CALCULATE(
             CALCULATE(
                 SUM('Calendar'[Is Weekday]),
                 FILTER(ALL('Calendar'),'Calendar'[Date] >= MAX(Data[Date Received])),
                 FILTER(ALL('Calendar'),'Calendar'[Date] <= MAX(Data[Date Approved]))
             )
          )
     )
In this final formula, lines 6 and 7 are two independent FILTER functions each operating over a single column in the Data table. With this structure, the Vertipaq engine can complete each operation (independently) really fast, and without decompressing the data.
This final formula is fine over a relatively small data table, but would still not be efficient over a very large data table. What is “large” depends on your computer.
You can download the sample workbook here.
I will cover a more detailed description of context transition in a future post.
If you like the way I explained this problem and you are a starting out on your formal DAX learning, you may like to consider reading my book “Supercharge Power BI“ for a complete and structured way to build your DAX skills. If you want more guided learning you can enroll to my Power BI Online training.


I have just entered the intermediate stage of DAX. This post has left me shocked at the complexity of DAX.
Is it safe to assume the following: when calculate has a second parameter (let’s say a filter), then context transition does not happen (I still don’t understand why 🙂 ). Conversely, if calculate has a single parameter, context transition always happens. Is this the right inference?
I think the short answer is no. The longer answer is that this post is 7 years old, and it is fair to say I know a lot more about DAX now than I did in 2016. I think this post really needs to be updated. I don’t have the time to do it now, but I will make a note and consider doing it in the future. My gut feel today is that I would do it as a calculated column in the fact table (exactly what I advised against in 2016)
Sorry I can’t offer more than that at this time.
Thank you for your response Matt. I know it isn’t possible to devote time to every comment on your articles. BTW, I tried to compare the below two formula on my own datasets – CT happens in one but does not happen in the latter unless you use the double calculate. In both of these, I assume the second parameter, after the comma, gets executed first. I guess I will just have to live with your short answer for now 🙂
1. calculate(sum(Sales[sales amount]),Sales[Quantity]>1)
2. calculate(calculate(SUM(Sales[sales amount]), filter(Sales, Sales[Quantity]>1)))
The second parameter definitely gets executed first before CALCULATE can force any context transition.
Your first formula above is syntax sugar for
calculate(sum(Sales[sales amount]),filter(all(sales[Quantity]),Sales[Quantity]>1))
Hi Matt, I would like to understand this very interesting article about the double calculate. However I believe that the images in this page correspond to a different article so we can’t see the formulas at all.
Great Post. When i first saw the double CALCULATE I admittedly didn’t understand the need. After your explanation it made perfect sense. It is posts like this that point out the subtle nuances of the inner workings of DAX that are required for learners to master the language. Thanks.
Thanks Matthew. As I often say, we are all learning this stuff, so the more sharing we all do, the faster we can all go.
Thank you, Matt!
Very good way of teaching. Your posts helps me a lot.
Kind regards,
Ivan
Great post Matt, very clear and useful.
Thanks!
FP
Hi, Matt.
Thank you for your post.
That task can be solved with CROSSJOIN (I removed relation between Data and Calendar table that is why it is not required to use ALL(‘Calendar’))
SUMX(FILTER(CROSSJOIN(‘Data’;’Calendar’);
‘Data'[Date Approved] >= ‘Calendar'[Date]
&& ‘Data'[Date Received] <= 'Calendar'[Date]
)
; 'Calendar'[Is Weekday]
)
Regards,
Matt,
I love your well-structured, concise, clear and easy-to-follow teaching method. Will catch up soon in your live classroom to further digest these hard stuff of DAX.
All the best,
Hans
Really useful solution Matt, and thanks for taking the time to work through the process, as this really helps understanding the final solution.
You’re welcome. I think it is important to work through the process – this is the normal way we all learn – me included. Over time with experience you just “know” how to do it, but until then, we all learn by doing 🙂