Level: Intermediate
Updated: 10 Nov 2020
I first wrote this article about how to import Tabular Data from Power BI into Excel back in Jan 2017. The benefits of extracting tabular data are still the same as they were back then however the process of extracting the tabular data from Power BI has changed. This update today re-presents the concept and shows the current process to complete the task.
What Problem Does this Solve?
Let’s assume you want to get a table of data from your data model, eg a printable list of customers with their annual sales year to date. Let’s say that there are 50,000 customers. How do you do this?
- You can create a table visual in Power BI, but you can’t print it from Power BI.
- You can’t export it to Excel because there is a 30,000 row limit. Besides, doing so will mean the data will go stale.
- You could use paginate reports, but that is a premium feature; besides, that is a whole new area for many people.
- The standard Analyze in Excel can only view the data in Excel via a pivot table, not a table of records. It “can” work, but it is clunky (in my view).
- You could download the Power BI Desktop file to your PC and use DAX Studio, but you have to download the entire model just to get the records you want.
Create an Excel Table Connected to Power BI
This technique allows you to write a DAX Query and run that from within an Excel workbook table with a live connection back to an online Power BI Dataset. The example I am going to use in this article about extracting tabular data from Power BI is to create the below table of Products by Colour with the total sales for each colour. I am using this as a demo to show you how to do it. If I actually wanted to build this table, I would frankly just use a pivot table. But it is the concept I want to show, not the outcome.
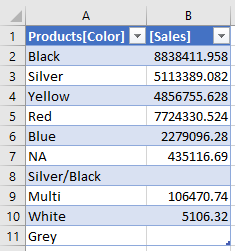
The steps to complete this process so you can import your tabular data from power bi are.
- Create the connection to your PowerBI.com data source
- Create a table that links to the source
- Write the DAX query that gives you table you want
Here is a walk through.
Create a Link to PowerBI.com
There are a few ways you can do this. You could use Analyze in Excel to create the link starting from PowerBI.com.
- Select the dataset from the Power BI Service
- Click the overflow menu
- Select Analyze in Excel
- Power BI will download an Excel Workbook with a connection to your Power BI dataset online.
The other way is to start from Excel. Note: This is only available in the most recent versions of Excel. If you don’t see the feature below, you should use the Analyze in Excel approach mentioned above.
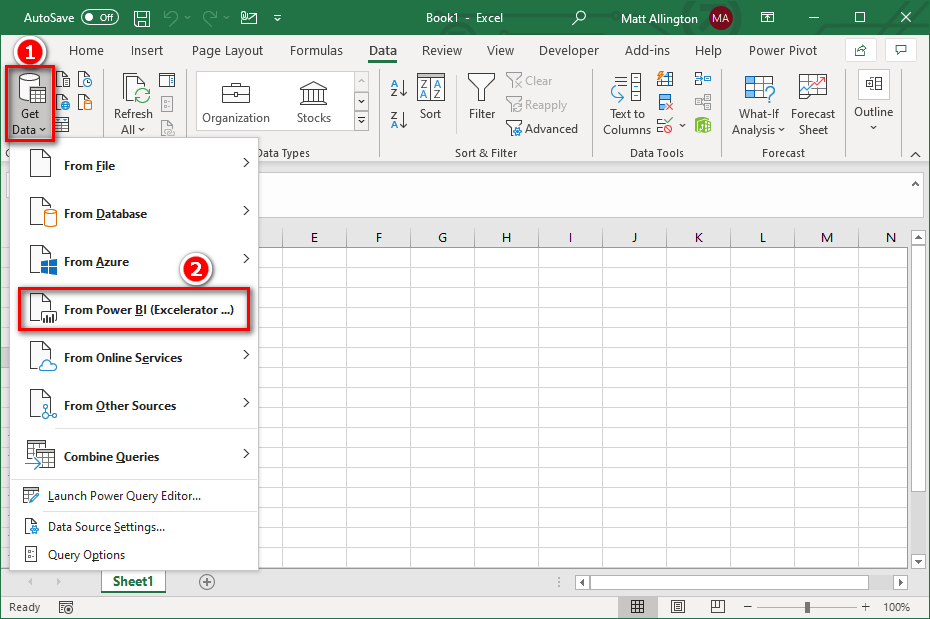
You can directly connect to a Power BI Data Set from within Excel. Start with a brand new Excel file, go to the data menu and click on Get Data (#1 below). Then select From Power BI (#2 below).
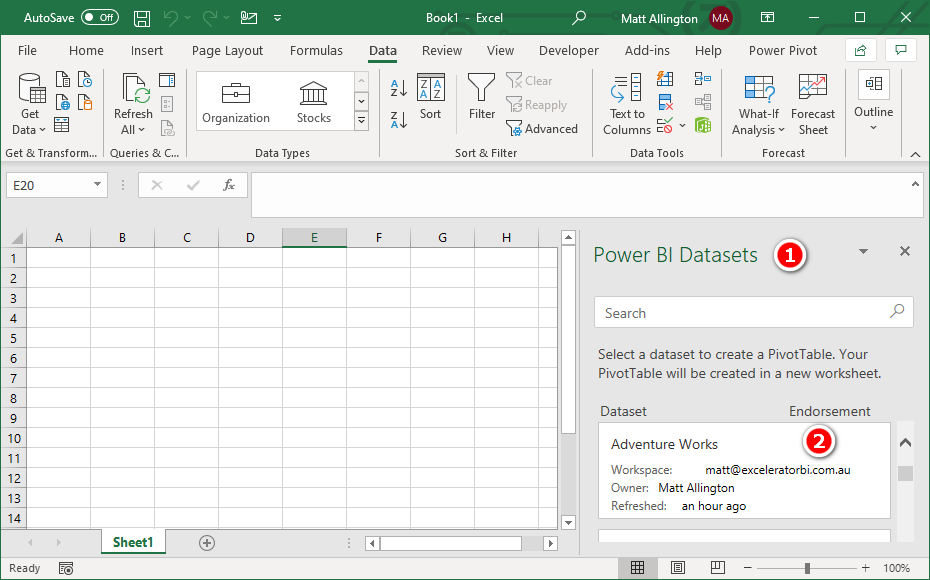
Go to Power BI Datasets (#1 below) and then select the dataset you want to use (#2 below).
The Power BI data model gets connected to Excel and an empty shell of a pivot table appears on the worksheet.
Create a Table that Links to Power BI
This is where the secret sauce is. The easiest way to extract tabular data from Power BI by creating an Excel Table linked to Power BI is to first create a pivot table. Just create anything simple, like this.

Actually, you don’t even need the years, you can just add any measure into the values section, and that’s it.
Double click on any one of the data points in the pivot table. When you do this, Excel will create an Excel table showing you all the records that make up the value in the pivot table.
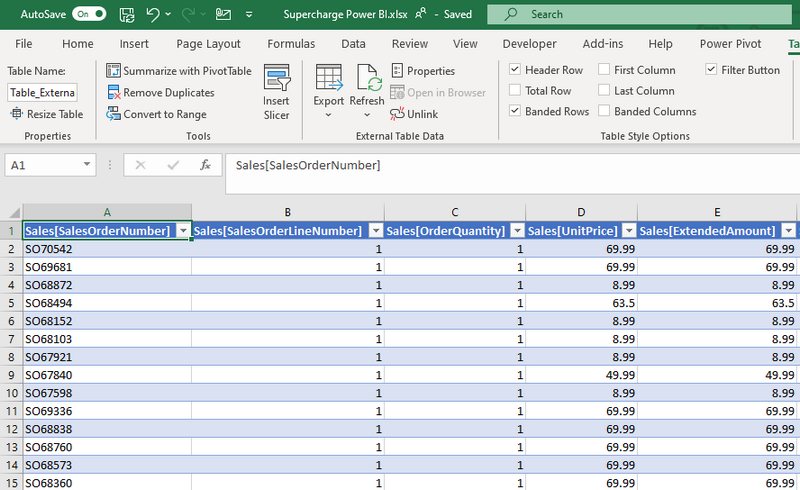
This new table has an underlying connection to the Power BI Service. You can now delete the pivot table sheet – it is not needed anymore.
Write the Query
To do this next step, you need to learn a bit of the DAX Query Language. I am not going to go into the DAX Query language in detail in this post as I cover that extensively in other blog articles. This one is a good place to start. I will simply show how to edit the current table code so you can build the table you need.
To edit the query, I simply right clicked anywhere in the table (#1 below), then selected Table (#2 below), then Edit Query (#3 below).

This brings up a dialog like the one below. The connection string at the top can be edited if needed, eg if you want to change the connection to a different report. The command text that you can see at the bottom can be deleted and replaced with any valid DAX table query.

To demonstrate, I could write a simple DAX query as follows.
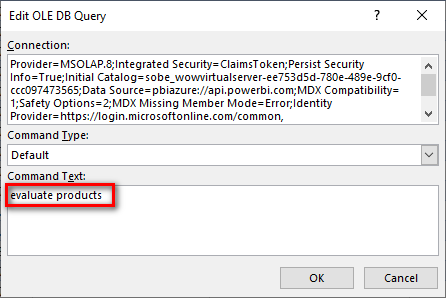
After clicking OK, the query is executed against the service and the table (Products in this case) is returned to Excel.

Total Sales by Product Colour
Next, to get total sales by product colour, I edited the query as shown below.
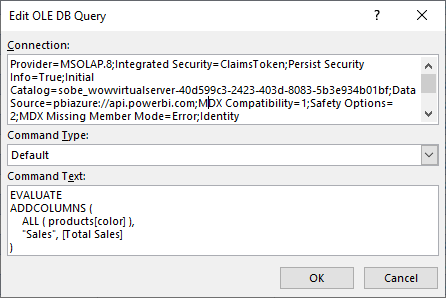
Here is my query
EVALUATE
ADDCOLUMNS ( ALL ( Products[Color] ), “Sales”, [Total Sales] )
And this gave me a table of all product colours and the total value of sales for those products as shown below.

I could have used SUMMARIZE instead of ALL to get only the colours with sales.
Interestingly the number formatting for Total Sales did not flow through to Excel as I expected it to. First I thought this was a bug, but the more I thought about it, the more I think this is “working as designed”. The representation of the Sales above is actually not the measure [Total Sales] that has the formatting. It is actually a new column projection in a new table that uses the Measure as an input. The new column clearly does not inherit the formatting from the measure. It would be useful it if it did, but think about the following query.
EVALUATE
ADDCOLUMNS (
ALL ( products[color] ),
“Markup %”, DIVIDE ( [Total Sales], [Total Cost] ) – 1
)
The above query returns a % markup as the new column. The measures [Total Sales] and [Total Cost] are both formatted as $ with zero decimal. So how will the query know to return % as the number format? I therefore think this is working as designed. The good news is that if you apply the formatting you want to the entire column of the new table, the formatting will be applied to all values in that column even if the column grows or shrinks on a future refresh.
What Next?
Once you extract the tabular data and finally have a table, you can use the Excel print capabilities to turn this into a paginated report (if you want to). Eg you can repeat the headers on each printed page, etc. To refresh the table, just right click on the table and select “Refresh”.
Further Learning
If you finally know how to import tabular data from power bi and would like to learn more about DAX as a query language, you can check out my series of articles that starts here An Introduction to DAX as a Query Language

Hi Matt
Thanks for the great article!
I deployed this in my organization, and it works well.
However users get prompted for Azure authentication more often than not ( that too twice at a time) when they open it in their PC.
Any solutions please??
Thank you !!!!
mmm, not sure, sorry. I haven’t seen it, so it is hard to say.
Thank you for the reply Matt!
Yes, I tested it by creating a role and doing all necessary stuff for rls( access, permission).
The thing is, in the Pivot Table i.e. Analyse in Excel (OLAP) the RLS works fine.
But as soon as we extract data the way you showed, the RLS is not adhered to, and user can see all data.
Like u said this seems like a bug.
Can u maybe test it as well?
Thank1ls!
It does not adhere to the RLS roles? I tested
I’m not saying you are wrong, but I would however be very surprised if it doesn’t work. How did you test it? Did you set up a test user with appropriate RLS limits then deploy with appropriate access via an App? If so, then this needs to be reported as a bug to MS
Thank you for the reply Matt!
Yes, I tested it by creating a role and doing all necessary stuff for rls( access, permission).
The thing is, in the Pivot Table i.e. Analyse in Excel (OLAP) the RLS works fine.
But as soon as we extract data the way you showed, the RLS is not adhered to, and user can see all data.
Like u said this seems like a bug.
Can u maybe test it as well.
I just tested it. RLS works for me with the above scenario. My guess is you are not securing the RLS correctly, but I can’t be sure.
Thanks Matt! Maybe am doing something wrong . I’ll check!
Awesome!
I recently switched form using SSAS tabular data models to importing straight into PBI datasets.
Some users require granular row-by-row output that would be clumsy to generate with pivot tables.
The ability to write a DAX query was taken care of for SSAS using the import “From SQL Server Analysis Services Database (Import)” dialog.
However, it was missing when migrating to PBI data models.
Thanks!
Vince
Matt, thanks for this article, it is very helpful.
One of the datasets that I need to access only has implicit measures and I cannot get the DBA to make them explicit. So, Excel brings over the value field as text when I access the dataset from the Service. Thus, I don’t have a field that I can use in the values section of the PivotTable to use your method above. I can populate the rows and/or columns but not the values. When I try double clicking on one of the cells in the PivotTable without a value then I get an error message that says cannot drill down. Any ideas on how to get the connection string in a situation like this?
I don’t know any way to do this unless you can first drill down from a pivot table connected to your data source. One thing you could try is to create a thin workbook in PBI Desktop connected to the model you cannot change. then you can write you own local measures. Read about it here https://exceleratorbi.com.au/new-power-bi-reports-golden-dataset/
Publish your thin workbook and go through the process. If you can get it to work, then you have the table configured, you may be able to change the connection string and repoint Excel back to the original dataset. I can’t be sure if it will work, but post back if you discover one way or the other.
Matt, thanks for the quick reply. I had previously created a thin workbook in Desktop and published it to the Service but it only shows up there as a report, no dataset. So, when I use Get Data from within Excel I do not see the thin workbook since it is a report not a dataset in the Service.
I tried creating a calculated measure in Excel using StrToValue to convert the implicit measure into an explicit measure inside Excel (akin to local measures in PBIX) but the field returned blanks. I even tried multiplying the text field * 1 to get a numeric result for the local measure in Excel and that didn’t work either.
Seems like a simple problem, but I have spent lots of time trying to come up with a solution. All to no avail.
Thanks,
Eric
Ah yes, I forgot there is no model in a thin workbook. I will ask MS why insert table is still disabled in this day and age. Maybe they can change it. In the short term, all you need is your DBA to create one single measure to make it works. You then get your table and cand write the DAX you need in the query.
I have some data that only changes once per month (when new invoices are generated). I tried testing the refresh but changing a field’s number or deleting rows and clicking refresh but that doesn’t do anything, even if I freshly update my Power BI data source. It does work if I go to Table > Edit Query > OK. I’m hoping my end user will not have to do that to refresh? Is it smart enough to know when the underlying data has actually changed and it will change any manual changes/deletions at that time?
I don’t know what you mean by “changing a field’s number or deleting rows”. What is in the table is a result of the query. If the query is refreshed, a new set of data should populate the table based on the current data in the model.
Hey Matt – I just showed someone this tip in my very last hour of my last day at my current position, and it felt good to go out on a high note. So thanks, man.
Hey, it might be worth calling out that if the Table Name has spaces in it, you need to enclose it in single quote marks e.g.
evaluate ‘some table name with spaces in it’
Good luck with your next opportunity Jeff. Remember, never use SpacesInTableNames 🙂
Hi Matt,
great tip, thank you.
Now, if Excel table can get data from a PBI dataset, could one PBI dataset get data (as a table – defined in a similar way as you re describing here) from another PBI dataset?
I quickly tried using an OLE DB connector, slightly reworked the connection string (which works for Excel table), but finally got an error message “OleDb.DataSource does not currently support multidimensional data sources.”
Is there a solution for this?
Thanks again! JB
Not currently possible, however this feature was announced in May this year and is due for release imminently. The Dec version hasn’t dropped yet, and it could even make it into that version – I’m not sure. Keep an eye out. It is called composite models.
Hi Matt,
just a few weeks ago (Jan 20) MS released the export of summarized data including a live connection, which basically is a short cut to your description above, already including the DAX statement.
Now I’m trying to go the next step by using this connection as data source in Excel’s Power Query, allowing me to do further transformations on the data. Here I stumble across the same error message as JB did, using OLEDB and a adapted connection string.
Just over two years ago you mentioned this feature should be available soon. Do you have any updates on this?
Thank! Peter
I assume the feature I was referring to was the composite data models, but I can’t be sure. This feature has been released, but may not have solved this problem. If you think it is a bug, I suggest you log a ticket with Microsoft. That’s the best I can suggest – sorry.
Thank you for the reply, I can now see the option.
Could you let us know how to get the Get Data > From Power BI Dataset option within Excel
You will need to update your version of Excel. I have office 365 current channel version 2010 (Oct 2020)
Huge thanks Matt, I’ve really found this helpful and used Performance Analyser to copy the DAX query and then a bit of VBA to add on the automatic printing. Duh me, should have thought about using DAX to change the column names.
This is perfect Matt and works like a treat. I want to maintain the formatting I’ve created in the Excel workbook so that when I refresh the data, it doesn’t change back to the Power BI set column headers. For example, I’m importing in from a table called Planning Applications and the Excel workbook has the table name and the column name which is too long. Will do some more research as well.
Thanks Sue
You can use SELECTCOLUMNS, or ADDCOLUMNS. These all give you the opportunity to change the column names as the first of the 2 parameters, as shown below.
EVALUATE
SELECTCOLUMNS (
SUMMARIZE ( products, products[color], products[size] ),
“Colour”, Products[Color],
“Size”, Products[Size]
)
Note, I am first building the query I want using SUMMARIZE, then changing the name of the columns with SELECTCOLUMNS
Hi Matt, this is what we ususally called Linked-Back Tables (ref. to Russo/Ferrari books on Power Pivot), am I right?
Thx
Francesco
PS we just started the Power BI USer Group Italy here, and I am in it with some of my (best) ex University students!
I can’t be sure, but I think linked back tables are different. From memory, this is when they make edits to the table and reload it to the model.
This is brilliant and exactly what I needed !
looking at doing this, but in my excel, I can’t see the Power BI as a data source. Office 365 proplus.
I am in an office environment, so might just be the enterprise licenses at issue. Do do have PowerBI access in office 365.
Any ideas?
Yes. Just use the other option I talked about. Start with Analyze in Excel.
Thanks!
This was very illustrative, though unfortunately I couln’t follow through in a newer version of Power BI (Nov’20).
Two things happened:
i) The downloaded file was not an .odc, but a regular Excel file with a masked Pivot Table.
ii) On the alternative way to drill through the Pivot Table, I hadn’t the option of adding fields to the Values section.
I’m leaving this as a reference in case anyboday has the same issue, or knows a solution.
I’m gonna try to come back to this. Thanks.
Thanks for the heads up. I certainly don’t actively check all my past posts to make sure they still work ?. I will take a look at this one and possibly update it, so keep an eye out.
Diego MX,
i) yes it is sometime since now you have a regular Excel file with anyway a connection to the Power BI Service dataset and not an odc file anymore when analyzing in Excel from the service
ii) you need to use a measure, not a column. In case you have no measure yet, you can create it on PBI Desktop, publish again to PBI.com and then just refresh the pivot table of the Excel file (no need to redownload it from the service, the connection is still valid also the day after and so on). To download from the service the Excel file, you need pro license
Consider also you have now Analyze in Excel directly in Power BI Desktop but in that case you need to regenerate it everytime you reopen Excel as that will have a new connection all the time (it points to the PBI Desktop that has a new port connexted to Analysys Services everythime you open it). Advantage is, though you do not need any pro license and no need to go to PBI.com and download nor to repubish to see new measures or columns as this Excel file will point to PBI Desktop model, not to the Service model: a simpple refresh in the Pivot table will work
please i need to extract dax formula in this extraction steps
I explain how to extract measures on this blog https://exceleratorbi.com.au/excel-workbook-connection-local-power-bi-desktop/
Thank you! I have created a very complicated report (over 30 queries) in PBI and I have struggled to get the data into Excel in any usable way. Is it possible to import the data without the Table name being added to every column?
Sorry, I don’t understand what you mean by “without the Table name being added to every column”
In Power BI the column names are “Sales Order Number” and “Total Sales” but in Excel they are “Sales[Sales Order Number]” and “Sales[Total Sales]”. I have been able to rename the columns the Excel Pivot Tables I have to build off the data, so it’s not that much of a pain to deal with, but it would be nice to avoid in the first place.
Hi Josh, did you ever fix this, Sue
May I suggest you to add a hyperlink in your sample files whether it be Excel or Power BI Desktop, then readers can get access to the related blogs immediately.
My demonstration uses my files hosted on my PowerBI.com account and will not work for anyone else. If you want to test this out, you will need to execute the process with your own account.
Hi there Matt, great blog post.
I did a test using Excel 2016 (64bit) and connected it to Power BI and tried to download a dataset that has got 1.6 million rows. And what happened is that it said that the sheet limit was 1 million rows. So even thought I had more data, it would not load it to the Excel Pivot Table sheet.
In terms of how I got to 1 million rows, what I did was I put in my measures, and then added the related data from the Power BI Model, and once I put in the Customers data, this got it over the 1 million mark.
What I also did to get it to display as an exported set of data, is I went into the Design Ribbon once I clicked on the Pivot Table, and then selected the following options.
– Subtotals “Do Not Show Subtotals”
– Grand Totals “Off for Rows and Columns”
– Report Layout “Show in Tabular Form”
– Report Layout “Repeat All Item Labels”
And then finally what I did was I clicked on Analyze in the Ribbon and then where it says “OLAP Tools” and then clicked on “Convert to Formulas” which then makes it look like text.
One thing to note is due to getting the data from the Power BI Service, it can take time for the data to be populated.