I have many reasons for sharing content online. The main reasons are that I like sharing what I know, but also that I want to document how to complete a task for future reference. My article today ticks both of those boxes.
How Many Employees by Period
I’m calling this article, “How many employees by period”. Staff come and go for different reasons. In some companies, the number of staff can change over time. The principles used in this article can also be used in other instances. There can be staff moving in and out of departments, on and off of projects, etc. The technique can also be used to work out how many staff were on leave, how many off sick, how many tickets were open in a support queue, or any other concept that has a start and end date in a transactional table.
The demo data I am using here will be used to calculate the total number of staff that were employed in any given year, but it works equally well for any other period of time.
Every time I have solved this problem in the past I have started from scratch and had to think through the filtering behaviour needed prior to writing the DAX. This is the last time I will do that :-). Instead, I will now be able to check back here to find the exact filtering behaviour needed.
The Problem Explained
Consider the below table of employees. Note this is a unique list of employees, and there is a start (commenced) and end (departed) date column.

The objective is to find the number of employees in a given year. To understand this more clearly take a look at the green bars added below. The green bars span the time period covering the employment.
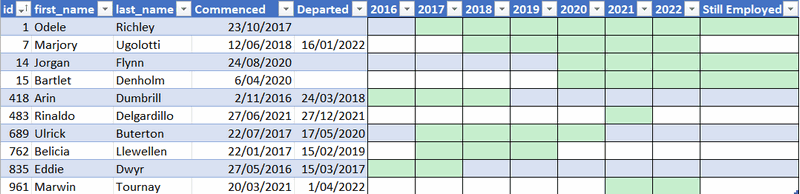
As you can see above, In the year 2019, the number of employees is 4.
- 1: Odele commenced in 2017 and is still employed
- 7: Marjory commenced in 2018 and left early in 2022
- 689: Ulrick commenced in 2017 and left in 2020
- 762: Belicia commenced in 2017 and left early in 2019. She was employed in 2019 because she was there for at least 1 day of that year even though she left during that year.
The solution to his problem
It is not possible to solve this problem using relationships. A relationship is designed to push a filter from a table (a calendar table in this case) onto another table. The use of relationships in this case will not work because the requirement is to filter for a range of dates, between the start and end dates.
The solution therefore is to “harvest” the start and end dates from period (year in this case) from the Calendar table, and then use the start and end dates to put filters on the employee table using formula based filters – no relationships needed. I am not going to write out the solution, step by step; you should watch the video for that. But what I have shown below is the final filter logic that is needed as well as the structure of the DAX formula. This will make it easy to refer back here later when you need a quick, correct solution to the problem.

Total Employees =
VAR LastDateInPeriod =
    MAX ( 'Calendar'[Date] )
VAR FirstDateInPeriod =
    MIN ( 'Calendar'[Date] )
VAR Result =
    CALCULATE (
        COUNTROWS ( Employees ),
        Employees[Commenced] <= LastDateInPeriod,
        OR ( Employees[Departed] >= FirstDateInPeriod, ISBLANK ( Employees[Departed] ) )
    )
RETURN
    Result
Video
Here is the video where I walk through and explain how to solve this problem.
Your point of view caught my eye and was very interesting. Thanks. I have a question for you.
Thank you for your sharing. I am worried that I lack creative ideas. It is your article that makes me full of hope. Thank you. But, I have a question, can you help me?
Hi,
Any idea how to calculate the average from the final table?
2016 2
2017 5
2018 5
2019 4
2020 5
2021 6
AVG = 27/6 =4,5
But how to calculate it in DAX?
This is a classic “totals don’t add up” problem. Se this article, section 3 https://exceleratorbi.com.au/use-sum-vs-sumx/
try AVERAGEX(VALUES(Table[Year]),[The current measure you have that works on a year by year basis])
Brilliant, thank you! I have used this for all dates and it works.
Any idea how to calculate Opening head count and closing Headcount for a month provided the start date and end date of employee
Hi Matt
Great timing! I was just asked to do this. I am trying to calculate the previous year’s value using your example without success. Any help much appreciated. This is the DAX I tried:
Total Employees PY =
CALCULATE([Total Employees],
DATEADD(‘Employee date table'[Date],-1,YEAR))
My intuition is that it should work.
1. do you have a calendar table? Answer should be yes
2. If so, is it joined to the employee table? Answer should be no.
3. Is the date filter period in the visual coming from the calendar table? Answer should be yes
Assuming above, my gut feel is it should all work.
Great stuff! I have a similar challenge; power contracts periods of Monthly, Quarterly and Annual contracts from/to dates, with a fixed MWh volume and price for the period; how to calculate the weighted monthly average price? I have solved it in Excel, but I guess a PowerBI solution can build on your solution above. [Tip for a follow-up post :)]
Thanks for the post.
I would just add && ISNUMBER(Resources[Commenced] ) to the first Calculate filter to exclude Employees entered without a start date.
Perfect timing for me! Creating a Turnover Rate measure was a breeze after watching this explanation video! Thanks Matt
Matt, thanks for this solution. I had to tweak this for the departed date to be <= LastDateinPeriod. Otherwise, it was picking up the items that we no longer there at the end of the period as part of the total.
I also needed measures for additions (new) and reductions (left). I utilized the DatesBetween function and counted based on StartDate for the new and CloseDate from the left.
Thanks for the time you invested in this solution.
I would create a ‘daily view’. A record per day that the employee is in the company.
That way, you just need to do a distinctcount of the Id and you can rely on the relation with your date table.
It’s also much easier to perform reporting as: ‘Who has left this month?’ ‘Who is new this month?’…
In some companies, they only look at the last day of the month; that is just a filter on the date table ‘Is last day of month’.
Hi Johan, I was thinking the same. How would you create that “daily view” (a record per day based on start and end date) from Matt’s Employee table example? Thanks!
@Matt thank you for the great content!
Hi Mariana,
Sorry for the late response, but I didn’t came back to this topic earlier.
I solved it like this: (assuming that you have a column Start date and End date. For employees where the end date is not known, I replaced the End date with the last date of the current year)
Then, in Power Query, you add a new column with the formula
= Table.AddColumn(#”Changed Type”, “Custom”, each {Number.From([Start date])..Number.From([End date])}
This will create a list of all the dates (as numbers) from the Start date until the end date. You can then in the header of the column select the option ‘Expand to new rows’ and you’ll have a row per date.
Last step is to change the data type of this column to a date.
I use the same trick to create my calendar tables. Something like:
Source = = {Number.From(#date(2020,1,1))..Number.From(#date(Date.Year(DateTime.LocalNow()),12,31))}
I found that a lot easier than the List.Dates function where you have to calulate how many days you need.
Regards
Great. Actually the way you explain it, it’s simple – so thanks for that.
I do this kind of thing in a different context, but with a similar end goal.
What I do is create a table containing the buckets I want and use a metric referring to the fact table to populate the table.
So, in this case, I’d define a table of start and end dates for each period, and then distinctcount the number of employees using a calculate-datesbetween metric.
Best,