I was going to title this blog “MEDIANX and the X Functions”, but that sounded too much like a 2030s band, so I opted for MEDIANX returns blank in DAX. But the article does indeed cover more than just MEDIANX and the blank “problem”. But first some background.
I helped a customer with a strange issue this week – a measure was returning BLANK when intuitively it should have been returning some value. There were a lot of moving parts to the actual problem and how I solved it, and I won’t go into all that detail. What I will do however is use my experience and what I learnt this week to share some insights for you in this article:
- What an X function does
- How to build and use test tables in DAX
- MEDIANX, vs AVERAGEX
- The forgiving way DAX evaluates the definition of BLANK
If your eyes are not glazed over by now, then read on .
What an X Function does
An X function is a class of functions in DAX that are also known as “iterators” (note, there are other iterating functions too, like FILTER, but I am only referring to the X functions here). It is a big topic on its own, and this article is not going to be the definitive guide to X functions. But I will give you a couple of insights.
I have learnt a lot about how to teach people DAX over the last 6 years, and my teaching methods have evolved over that time. I remember fondly speaking at the Microsoft Data Insights Summit with Will Thompson on the topic “DAX 50 – DAX for the rest of us“. Will said to me “don’t mention the word ‘iterator’ as it is too confusing.”. I didn’t agree with Will at the time, but his comment stuck with me. Over time I have changed the day way I teach DAX. These days I show people how to add a calculated column in a table (everyone can do that – its dead easy). Then I explain that an X function does exactly the same thing, it’s just that you can’t see the interim results materialised in front of their eyes.
Let’s look at an example for clarity.
Example
I am using my standard Adventure Works simple star schema for this example.

Let’s say I want to write a measure that returns the median amount spent across all customers. The issue is that I don’t have the total sales for each customer in my data model. I have a customer table and a sales table, but nowhere is there the total sales for each customer.
Now, I could calculate the median sales across all customers by first calculating the total sales for each customer in a calculated column in the customer table, and then add a visual to my report to work out the median as shown below.
Measure: Total Sales = SUM(Sales[ExtendedAmount])
I created a Calculated Column in the Customer Table: Cust Sales = [Total Sales]

As you can see above, I can now see the total sales for each customer.
Then all I needed to do was add a visual to the report canvas (1 below), add the calculated column (2), and set the aggregation to MEDIAN (3).
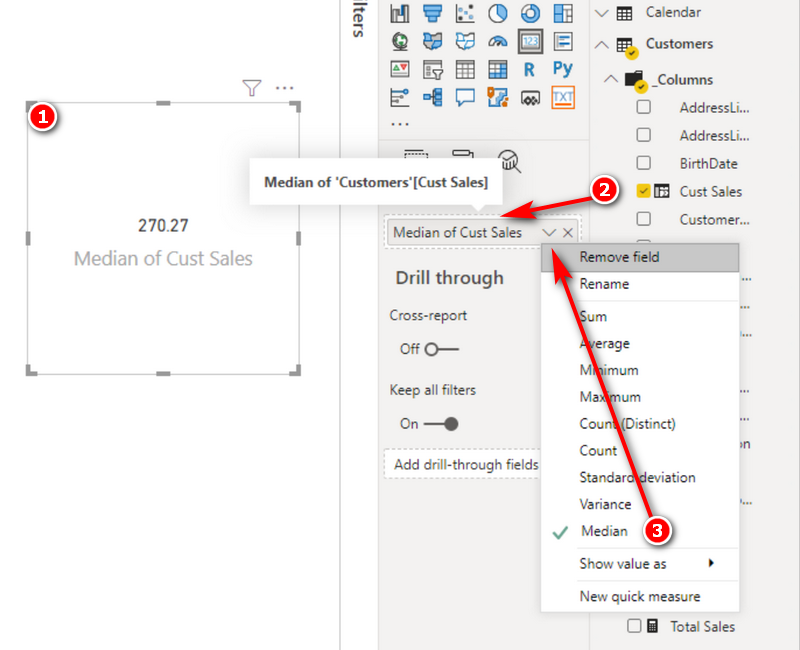
As you can see in the image above, the answer is 270.27. The problem with this approach is I had to write a calculated column to get the answer. While there is a time and a place for a calculated column, you don’t need to create a calculated column to get this answer. The point I am trying to make is that the calculated column above is conceptually easy for anyone to understand. It’s easy to write, you get to solve the problem one step at a time, you get to see the interim results, and anyone with an Excel background can do it with very little understanding of DAX. Understanding the MEDIANX function is much harder; harder until you realise that MEDIANX is doing EXACTLY the same thing as this calculated column.
Here is the MEDIANX formula.

Median Customer Sales Measure = MEDIANX(Customers,[Total Sales])
In the formula above
- The X (blue) is the indicator this is an X function. This is the clue that this is one of the functions that behaves like a calculated column.
- The table (green) is the table you would have written your calculated column in if you were doing it that way.
- The measure (orange) is the formula inside the calculated column you would have written if you did it that way.
- The MEDIAN (red) is what happens to the numbers at the end.
Here is the lesson – An X Function is exactly the same as a calculated column. The only differences are that 1) you can’t SEE what is happening and 2) it doesn’t permanently store the row by results anywhere. But the process of doing the calculation is identical.
Now, the truth is that there is a lot going on under the hood to get this result. There is a hidden implicit CALCULATE function, there is a row context and context transition, but the point is that it is not essential that you understand all this technical stuff to be able to learn a bit more about how to use and understand DAX. The way I teach DAX these days it to show people how to do a calculated column, then show people that the same thing can be done (in this case) using a measure and an X function. The moral here is, if you are trying to write a measure, you get stuck, and you know how to do it as a calculated column, then first create the column, then work out how to migrate it to a measure from there using the principle I have demonstrated.
How to Build and Use Test Tables in DAX
Now back to the customer problem – why did MEDIANX return a blank? It occurred to me the easiest way to visualise what was going on was to build a run time table of values using the { } curly brace operators. I learnt how useful this technique is when watching demos and posts by two really smart DAX people (Phil Seamark and Owen Auger).
Test Measure = MEDIANX({1,2,3,6,9},[Value])
The way this measure works is that the bit in the brackets (green) generates a run time table. The orange part [Value] allows me to access the values in the single column of the table I just created. The red and blue bit are the same as before.
The function above returned 3

Then I decided to try AVERAGEX

For the record, AVERAGEX will return the mean value (total divided by count) where as MEDIANX will return the middle value. In the case there is a tie for the middle value (ie an even number of values), it is the mean of the 2 mid values.
Then I wrote the following test measure.

Then this

And then the penny dropped for me. What would happen if I wrote this?

These test measures really helped me understand what was going on under the hood, and I hope it has helped you too.
The DAX language is very forgiving.
DAX is a very forgiving language. In many (most) other languages, a blank or a null are not evaluated to the same result as 0. In the DAX language, a blank or a null will evaluate to 0 unless you explicitly tell it not to, using the new == (double equals sign). Stated differently, 0 = BLANK() is TRUE, while 0 == BLANK() is false. I call the double equal sign “really equals”, but the official name is “strict equal to”.
Test Measure = MEDIANX({BLANK(),BLANK(),BLANK(),6,9},[Value])
With that in mind, the test measure repeated again above is evaluating the blanks as if they were numerically 0 when doing the median evaluation, and then finally returning the native BLANK() at the end. Of course, the difference between average and median is that median returns the midpoint number. In this case the midpoint is a blank and hence this is the result that was returned.
Now, if you didn’t want blanks to be treated as 0, you would have to filter them out prior to calculating the median.
Ignoring BLANKS() in a MEDIANX
This turned out to be a bit more involved than I thought it would be. First I needed a new sample to test. I created another calculated column, this time into the Products table. I knew from previous experience that not all products have sales, so this would return some blanks. See below.

When I added this column as a card to my report, and set the aggregation to MEDIAN, this is what I got.

When I wrote the equivalent test measure using MEDIANX, this is what I got
So I have to say, I was very surprised that my calculated column and my measure gave me a different result. After a bit of further testing and investigation, it turns out that when you use a column in a card in Power BI and find the median value, the visual automatically filters out the BLANKS for you, whether you want that or not. I couldn’t see any way to change this behaviour.
Part 2 Next Week
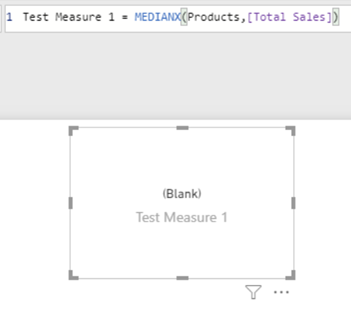
Solving the problem of MEDIANX as a measure is a bit harder than with a column. The issue is that the column doesn’t actually exist when you write it as a measure, yet you still have to filter out the blanks before doing the calculation. You could try to write a measure like this…
Test Measure 1 = MEDIANX(Products,if([Total Sales]=0,BLANK(),[Total Sales]))
but you will end up with the same result, because one of the results of the IF statement simply adds the BLANK() back again.
Writing a measure for this is a big topic by itself, and I will explain how you can use DAX Studio (step by step) to solve such a problem in my next article next week.
Thanks for sharing. I read many of your blog posts, cool, your blog is very good.
Really eye -opening article. Thanks
Hi Matt,
thank you very much for this article. I’ve learned a lot again. The use of curly braces as an operator for testing purposes is new and very helpful for me. The automatisms in the background are not very conducive and therefore thank you very much for this information. Now I read the second part to this good article.
Regards FrankAT
Excellent Article!
Won’t a measure like this work?
MEDIANX(FILTER(table, NOT(ISBLANK(table[column]))), table[column])
The column of sales by product doesn’t exist, that’s the issue. Of course you could create it, but that misses the opportunity to learn some new skills.