Level: Intermediate
Pareto Analysis is a statistical technique that applies the Pareto Principle to data. This is more commonly known as the 80:20 Rule. The Pareto Principle is based on the presumption that a relatively small number of inputs (20%) have most impact on the results/output (80%). The 80:20 rule can be applied to a wide variety of data in most businesses. Examples include:
- Which 20% of products make up 80% of sales
- Which 20% of customers make up 80% of profit.
- just to name a few
Although it is called the 80:20 Rule, the results normally do not come out exactly in the ratio of 80:20. Anything close to this ratio is considered normal. Armed with the results, you can focus business efforts on the 20% of the things that impact 80% of the results.
The Pareto Principle can be illustrated on a Pareto chart. In Power BI you can use a combo line and column chart. The column in the chart represents the individual inputs, while the line chart represents the cumulative percentage of the inputs as they build towards 80%.
In order to show you how to build a Pareto chart in Power BI, I will use in this article the AdventureWorks database (as usual) to show that just 12% of the products (in this case) contribute to 80%of the total margin for the business.
Measures Used for A Pareto Chart
To start with I have created 3 measures in the Sales table.
Total Cost = SUM(Sales[TotalProductCost])
Total Sales = SUM(Sales[ExtendedAmount])
Total Margin = [Total Sales] – [Total Cost]
Next I needed to write the measure that would calculate the cumulative % of sales ranked from the best product to the worst. This is a tricky formula, but I explain how it works below.
Cumulative % =
VAR thisProductMargin = [Total Margin] /* this sets the margin for the current product
                                          (the one that is the current column in the column chart) */
VAR TotalMarginAllProducts =
    CALCULATE([Total Margin], ALL(Products)) /* the total margin across all products.
                                              This is needed to turn the absolute margin into a percentage */
RETURN
    CALCULATE(
        [Total Margin],
        FILTER(ALL(Products), [Total Margin] >= thisProductMargin)
    ) / TotalMarginAllProducts
To understand how this formula works, I will need to refer to the results table shown below showing the product codes, Total Margin in $ for each product, and the Cumulative % of margin. Note that the table is sorted from highest margin $ product to the lowest margin $ in descending order.
The first row in the table below is product 312. It has a margin of approximately $474,151 which makes up 4% of the total margin for all products. Each row in the table below is calculated completely independently of each other for both the Total Margin and Cumulative % measures.

Now, let me explain how a single row is calculated (the row highlighted in red below – ProductKey 363).
The highlighted row in the table below is filtered for ProductKey = 363. This is what the row section of a table does – it filters the data before the measure is calculated.
Line 2 in the measure above is a variable. Variables are defined first as part of a measure before any other execution is completed. So the variable thisProductMargin is assigned a value of $437,021 in this case.
Line 4 in the measure above is pretty straight forward. It uses CALCULATE to remove the filter on ProductKey = 363 so it can calculate the total margin for all products. The ALL function removes all filters on products.

The secret sauce of the formula is line 10.
-
- Filter is an iterator and hence it has a row context (it can repeatedly evaluate a formula, one row at a time, as it steps through the specified table). In this case it is going to step through the products table.
-
- But there is a filter on ProductKey = 363, so FILTER needs to step through ALL(Products) instead of Products. ALL removes the filter applied by the visual before FILTER starts it’s iteration process. If I didn’t use ALL here, then there would be only 1 row in the table. ProductKey = 363 due to the filter coming from the visual.
-
- Then FILTER steps through the unfiltered copy of the products table and checks each product, one at a time, to see which individual products have a margin greater than the current product. The current product is ProductKey = 363.
-
- If FILTER comes to a product that has a margin greater than Product 363, that product is kept – in other words that product forms part of the cumulative build of all products that make up the cumulative total.
-
- FILTER continues to check every single product against this criteria.
-
- At the end of the filter process, only products with a total margin greater than or equal to the product being compared (product 363 in this case) are kept.
-
- Then the total margin for all those products is calculated.
-
- Finally this total is divided by the total for all products.
The process then repeats for every single row in the visual, over and over again.

Creating a Pareto Chart in Power BI
As I mentioned above, we can use the line and clustered column chart visual to display the Pareto chart. To do that:
-
- Add a Line and clustered column chart visual to the Report canvas.
-
- Put ProductKey from the Products table on Shared axis.
-
- Put Cumulative % from the Products table on Line values.
-
- Place the [Total Margin] measure on Column values.
-
- Sort the chart based on Total Margin, Sort Descending.
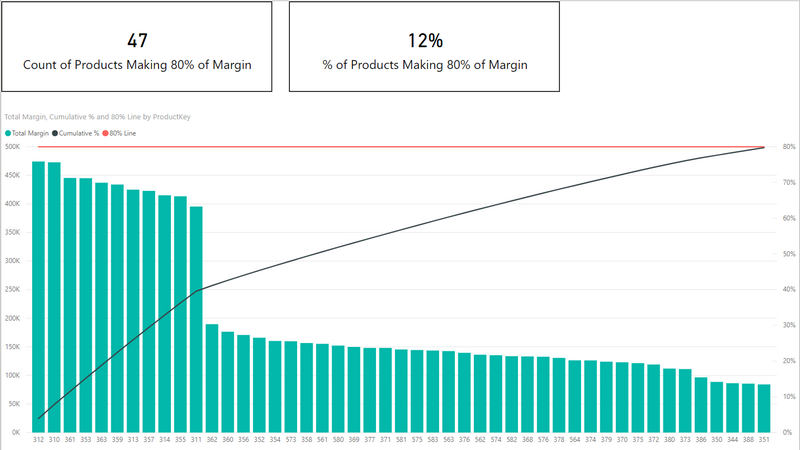
This will sort the columns in the chart in descending order as you can see above. I then went ahead and wrote a measure to count the number of products that make up the 80% of margin. That measure is as follows.
Count of Products Making 80% of Margin =
     CALCULATE(
         DISTINCTCOUNT(Sales[ProductKey]),
         FILTER(Products, [Cumulative %] <= 0.8)
     )
Here is my Pareto Analysis workbook if you’d like to take a look and learn more about the use of Pareto chart in Power BI.
Using your shared data, I found that 47 products generate ~80% of total margin.
The model shows 158 distinct products overall, so 47/158 is 29.7% of products drive 80% of margin.
However, the dashboard states 12% of products reach 80% of margin.
What could cause this difference??
My brother suggested I would possibly like this web site.
He used to be entirely right. This post truly made
my day. You cann’t believe just how much time I had spent for this information! Thank you!
Thanks for this detailed explanation. I would like to use ALLSELECTED() instead of ALL() in your example as I need to use some filters before it can be used for this calculation. But when I do so, it excludes some entries in the calculation. Also, I am referring data from only one table and not two tables as shown in your example.
You’re the best Matt, absolutely
Gracias Matt!!! muy bueno
Hi there
Is there a way to show (on X axis) % of products and (on Y axis) % of margin?
look into a scatter chart
Great article. Straight to the point.
I try to do pareto chart with my data (procurement), result was very well.
But lt can not count the number of products that make up the 80% of margin,result was “blank”.
Why?
Hi Matt,
I tried to add drill down functionality in the current pareto chart but getting incorrect result while doing so, I posted in the power bi community still didn’t get any proper result need a suggestion can we do drill down in the above scenario? Any example in the above scenario will be very helpful.
Just what I needed! Thanks, Matt!
Buenos días, tengo un inconveniente a la hora de armar mi Pareto ya que el mismo hace referencia a la cantidad de reclamos dentro de planta, y hay algunas piezas que tienen la misma cantidad de reclamos, y en vez de acumularse las medidas para luego poder calcular el % acumulado, las mismas se suman y el valor se repite en cada una de ellas, generando 2 filas consecutivas con iguales porcentajes (siendo que debería sumarse uno y luego el otro). Esto se ve reflejado con líneas horizontales en el Pareto. Que solución podría considerar?
Desde ya muchas gracias!
—
Good morning, I have a problem when assembling my Pareto since it refers to the number of claims within the plant, and there are some pieces that have the same number of claims, and instead of accumulating the measures to later be able to calculate the accumulated%, they are added and the value is repeated in each one of them, generating 2 consecutive rows with equal percentages (being that one should be added and then the other). This is reflected by horizontal lines on Pareto. What solution could you consider?
From already thank you very much!
Hola Lucas, me tope con el mismo problema. De casualidad encontraste alguna solucion al mismo???
Gracias!
—
Hi Lucas, I ran into the same problem. By any chance did you find a solution to it ???
Thanks!
This worked perfectly. After further training myself in Power BI by myself…… i was able to understand the formulas mentioned above. before the training it was all super code for me 😀 Thanks.
Thanks a lot Matt.
I am following you and learning from you.
Great job.
Hi Matt,
Thanks a lot, your methods works great on my “supplier spend analysis”.
However, i encountered a problem when i was trying to count the number of suppliers making 80% of margin.
The problem is:
I used your formulas , but it returned blank. However, when i changed the “cumulative % = any number, it worked well.
Only when i put cumulative %<=anynumber, it gives me blank data.
I really have no idea why it is, can you help me analyze it?
Thanks
Well, I don’t generally provide support for the content I share, but if you share a link via the contact us form (look at the bottom of the page) I will take a quick look.
Matt,
I’m impressed. However, I took your pattern and reused it for a project I’m running concerning Greenhouse Gas Emissions by Building (student accommodation). Unfortunately, my line in the combo shart is “flat” with a value of 1. Is there a way of sharing my PBIX if you’d be willing to take a look.
Best wishes,
Denis
Well, I don’t generally provide support for the content I share, but if you share a link via the contact us form (look at the bottom of the page) I will take a quick look.
I’m being stupid. You don’t need my PBIX just my version of your measure. To put this in context, My visual is filtered for Top 10 buildings(known as anonymized name) based on CO2 emissions. I’m trying to show that value as a percentage of total CO2 emissions – for all buildings but the measure below shows as a straight line. I hope you can help.
Cumulative TCO2 Gas/Elec =
VAR ThisBuildingTCO2 = [TCO2 Total Gas/Elec] /* this sets the emissions value for the Current building
(the one that is the current column in the column chart) */
VAR TotalTCO2All =
CALCULATE([TCO2 Total Gas/Elec], ALL(Sites2[Anonymised Name])) /* the total TCO2 across all buildings.
This is needed to turn the absolute Value into a percentage */
RETURN
CALCULATE(
TotalTCO2All,
FILTER(ALL(Sites2[Anonymised Name]), [TCO2 Total Gas/Elec] >= ThisBuildingTCO2 )
) / TotalTCO2All
Well your measure certainly seems to be the same pattern, but something is clearly not working. So what needs to be checked are
1. Your other measures
2. The model that supports your other measures, including the relationships
3. That the columns in the visual are from the right tables
I can’t do any of those things from what you have provided.
There are 2 issues
1. Your site name is sorted by an index. If you use a sort column, you need to remove that inside the ALL statement as well https://exceleratorbi.com.au/the-all-function-in-dax/
2. You have used a variable as the first parameter inside a calculate. Variables are immutable. Once they have been assigned a value, they don’t change. https://exceleratorbi.com.au/using-variables-dax/
You had this
Cumulative TCO2 Gas/Elec =
VAR ThisBuildingTCO2 = [TCO2 Total Gas/Elec] /* this sets the emissions value for the Current building
(the one that is the current column in the column chart) */
VAR TotalTCO2All =
CALCULATE([TCO2 Total Gas/Elec], ALL(Sites2[Anonymised Name])) /* the total TCO2 across all buildings.
This is needed to turn the absolute Value into a percentage */
RETURN
CALCULATE(
TotalTCO2All,
FILTER(ALL(Sites2[Anonymised Name]), [TCO2 Total Gas/Elec] >= ThisBuildingTCO2 )
) / TotalTCO2All
You need this
Cumulative TCO2 Gas/Elec =
VAR ThisBuildingTCO2 = [TCO2 Total Gas/Elec] /* this sets the emissions value for the Current building
(the one that is the current column in the column chart) */
VAR TotalTCO2All =
CALCULATE([TCO2 Total Gas/Elec], ALL(Sites2[Anonymised Name],Sites2[Index])) /* the total TCO2 across all buildings.
This is needed to turn the absolute Value into a percentage */
RETURN
CALCULATE(
[TCO2 Total Gas/Elec],
FILTER(ALL(Sites2[Anonymised Name],Sites2[Index]), [TCO2 Total Gas/Elec] >= ThisBuildingTCO2 )
) / TotalTCO2All
Hi Matt! This post was super helpful! Thank you so much for posting. I modified it a bit to work for my specific purpose but ran into an issue and was curious about your thoughts. As the measure is being computed row by row of the visual, if there are Products with the same Total Margin, the cumulative measure seems to group them together, since it meets the criteria of [Total Margin] >= thisProductMargin. Any way to avoid that?
Hi Mark. I don’t know of a way. It relies on the ranking of the margin rates vs the others. Even if you did separate them, it would be arbitrary anyway
Thanks for responding, Matt. That is what I was expecting, but figured I would see if the expert knew of a way around it! Thanks again for the post and the reply!
Hi, thanks for the article. I have a query about what to do when you have a stacked column combo with the pareto.
How do I change the cumulative total measure so that the line values ignore the column series and are just evaluated on the basis of the column totals?
Well it depends on what the column is for the stacked bar chart. You will need to remove the filter from that column. Just add another filter into CALCULATE, like ALL(Table[Column]) to remove that filter
I have a stacked chart with the manufacturing plant as the columns, and the inventory $ value being used in the values area. The calcs above work perfectly until I add material criticality to the legend for the column. Do you mean remove the filter from the criticality column? Whereabouts in the code below would I insert that?
Cumulative % =
VAR ThisPlantSOH = [Total SOH]
VAR TotalPlantSOH = CALCULATE([Total SOH],ALL(Dim_IA_Plant_Desc))
RETURN
CALCULATE(
[Total SOH],
filter(ALL(Dim_IA_Plant_Desc),[Total SOH]>=ThisPlantSOH))/TotalPlantSOH
Thanks
These things are hard to say without trying it. My guess is
Cumulative % =
VAR ThisPlantSOH =CALCULATE( [Total SOH],ALL(Table[legend column]))
This was a great help for some client work.
I did run into an issue, which is when you have duplicate amounts — this logic will include all rows for that amount which may “jump” the cumulative % ahead (e.g. from 75% to 85%) and exclude all of those amounts from the pareto analysis when you would have wanted to include some of them just before the 80% threshold.
Couldn’t figure out a way to avoid that!
Thanks, I’m going to try this on my data… Btw:
Profit = revenue – cost
Margin = profit / revenue
I tried the following formula, getting blank value.
Cumulative % =
VAR CQ = [TQuantity]
VAR TQ = CALCULATE([TQuantity], ALL(Orders))
RETURN
CALCULATE(
[TQuantity],
FILTER(ALL(Orders), [TQuantity] >= CQ )
) / TQ
Hi Matt, This is a very interesting DAX calculation. I successfully implemented it on a 300k line dataset, I was very excited, but it didn’t work and ran out of memory. I end up doing the Pareto calculation as a fixed table using M Query. The performance is much better, but the trade off is that it’s less flexible (had to disable cross-filtering on a few charts), Thanks for sharing.
Yes, you are right David. This is a very expensive calculation. If you can live with non- dynamic results then it is much better. You can also generate a calculated table in Power BI instead of using PQ
Hi Matt,
Thanks for this amazing post, it helps me a lot. I used the discussion with Dominik to create my calculated column to classify my product regarding Pareto.
Below my calculate, if anyone want to use it :
Pareto =
VAR thisCustomersales = Articles[Total articles sales 12 rolling month]
VAR TotalSalesAllcustomers = CALCULATE ( SUM ( Articles[Total articles sales 12 rolling month] ); ALL ( Articles ) )
VAR PourcentageCumulesVentes = CALCULATE (
SUM ( Articles[Total articles sales 12 rolling month]);
FILTER ( Articles; Articles[Total articles sales 12 rolling month] >= thisCustomersales )
) / TotalSalesAllcustomers
RETURN
SWITCH(TRUE();
PourcentageCumulesVentes 0,5 ; PourcentageCumulesVentes 0,8 ; PourcentageCumulesVentes 0,9 ; PourcentageCumulesVentes < 1 ) ; "Hyper 80/20")9 ; PourcentageCumulesVentes < 1 ) ; "Hyper 80/20") I have a question remaining : how the calculate knows what is the product with the more quantity sold ? I want to be sure that my "hyper 20/80 products" stay the same even if I sort out the column. Tks a lot Erwan
Hi Matt,
Thanks for this amazing post, it helps me a lot. I used the discussion with Dominik to create my calculated column to classify my product regarding Pareto.
Below my calculate, if anyone want to use it :
Pareto =
VAR thisCustomersales = Articles[Total articles sales 12 rolling month]
VAR TotalSalesAllcustomers = CALCULATE ( SUM ( Articles[Total articles sales 12 rolling month] ); ALL ( Articles ) )
VAR PourcentageCumulesVentes = CALCULATE (
SUM ( Articles[Total articles sales 12 rolling month]);
FILTER ( Articles; Articles[Total articles sales 12 rolling month] >= thisCustomersales )
) / TotalSalesAllcustomers
RETURN
SWITCH(TRUE();
PourcentageCumulesVentes 0,5 ; PourcentageCumulesVentes 0,8 ; PourcentageCumulesVentes 0,9 ; PourcentageCumulesVentes < 1 ) ; "Hyper 80/20")9 ; PourcentageCumulesVentes < 1 ) ; "Hyper 80/20")
I have a question remaining : how the calculate knows what is the product with the more quantity sold ? I want to be sure that my "hyper 20/80 products" stay the same even if I sort out the column.
Tks a lot
Erwan
Really great stuff!! The Cumulative% formula is priceless.
I recently had need to do this and hacked my way through it. Now I know the best way to do it. Thanks Matt.
? there are definitely some performance issues when the number of items gets large (as can be seen by some of the comments). I may come back with an update to this post later with a way to cluster the data for improved performance.
Hi,
10x for great contnet.
there is missing formala in the article – I tried with 3 diff browser in 3 computer.
also the link for the workbook file is broken
can u please check
Thanks for letting me know, and sorry for the problem. I updated the website over the weekend and clearly this was a problem as a result. I found the problem and it should be fixed now.
Thanks for the article, and I agree, the book “Supercharge Power BI” is excellent.
You talk about using the AdventureWorks database. Is there a way to get access to this data just so we can actually follow along? It also seems like the Cumulative % is done in VBA or some sort of editor. Can you explain that to me a little better? I’m just starting to learn Power BI and your newsletters have been extremely helpful
My workbook is at the bottom of the post. You can go to the data view and copy any table you want into Excel. The Cumulative % is calculated on the fly by DAX. This is an intermediate level post and there is a lot to learn to understand everything. My best advice is to buy my book and read it from cover to cover. I don’t think there is a better way to learn (I may be a bit biased, but you could also read the reviews on Amazon for other people’s opinions). https://exceleratorbi.com.au/supercharge-power-bi-book/ You can also find the AdventureWorks DB at this link with my book details.
i can confirm, the book (both versions) are very useful
Thanks Marian. I always appreciate a book review on Amazon if you have a few moments. This helps other people find my book.
Hi Matt, as it happens we were talking about a Pareto analysis (per customer) in our organisation last week, so the timing of your article is excellent!
However, when adjusting the formula to my data model, I came across a simple problem: RAM.
When calculating this in the desktop version over our customers (1,2 Million instead of 397 products) and sales (11m instead of 60k) it just stops working after some time, saying that there’s not enough RAM available.
Any idea how to work around this problem in larger datasets?!
Yes, I figured it may be an issue with larger data sets. Are you using 64 bit Power BI? If not, that will help. Let me know. The other option is to simply switch the measure to a calculated column. This will work as long as the ranked item is a dimension table. In your case (and mine), both Customer and Product are dimensions, so the same formula will work as a calculated column. In fact, you can remove the ALL() in line 10 too when using it as a column. Please let me know how it goes
I’m using the lastest 64-bit version of PBI.
Just tried to add the formula as a column in the customer table (and removed the ALL() in line 10)…calculation was running for 30 minutes without a result, so I killed the application.
Thanks for posting back Dominik. I also have been doing some testing – even AdventureWorks with 18,484 was very slow, both as a measure and calc column (maybe 5 mins). I have been thinking about the problem and I have a new suggested approach for you to try. Please give it a go. It will still take a bit of time, but I think it will work for you. Please post back. with the time it takes. I will then update my blog with this information
Add 2 calculated columns. The first is simply
Total Cust Sales = [Total Sales]
Cumulative % Customer Sales =
VAR thisCustomersales = Customers[Total Cust Sales]
VAR TotalSalesAllcustomers =
CALCULATE ( SUM ( Customers[Total Cust Sales] ), ALL ( Customers ) )
RETURN
CALCULATE (
SUM ( Customers[Total Cust Sales] ),
FILTER ( Customers, Customers[Total Cust Sales] >= thisCustomersales )
) / TotalSalesAllcustomers
Hi Matt, thanks again for your help!
I added the two colums as suggested, however about 10 minutes after I started calculation for the second formula (Cumulative % Customer Sales) PBI stopped the process and the error message “There is not enough memory to complete this operation” popped up.
I’m working with a MS Surface laptop with only 4 GB RAM (will be upgraded to a new one with incredible 8 GB soon…), so maybe that’s part of the problem too.
Thanks for posting back. As you can tell, this is resource hungry. I appreciate your testing, and I would like to know it works before I update the article. There actually is a very big difference between 4gb and 8gb, is you will really notice it.
Hi Dominik and Matt,
I don’t believe you’ll succeed in making this work. At least not on the desktop. Running totals, Pareto Analyses and partly moving averages etc. applying huge dimensions will only be fully within reach when they are supported directly in the engine. Put in another way, only when we have DAX functions that will support these scenarios will we be able to do them in an acceptable way.
Upgrading your laptop to 8GB RAM won’t help in this case, Dominik.
That said, I don’t think you will ever do Pareto analyses this way. Think about it. If 20% of the customers make 80% of the margin you’ll have to show around 250,000 customers on the shared x-axis. There is no way you can get the big picture this way. Instead, you’ll set up slicers/filters that cross filter the customer table, so only a subset will be shown at any one time. This requires a slightly modified measure; however, it only takes a few thousand dimension values to make it a no go. How many depends on your hardware and data model.
As Matt also said somewhere in the comments; I would love to be proved wrong.
Jes.
Thanks for your comments Jes. I have learnt a lot from Dominik’s example. I have actually developed what I think is an acceptable work around for this using customer banding and a calculated column. I have it ready to go and it works fine on 18,484 customers in Adventure Works. I am hoping that Dominik will test it first on his million rows of customers to see if it works. Then I will update this post.
Matt, thanks for this great example. One quick question – would it be better to use only one field (Products[ProductKey]) instead of using entire table (Products) to avoid the concept of table extension which is super expensive operation from RAM prospective. it won’t be noticed on 397 rows but should make big difference on 1.2M rows.
If we rewrite line 10 (secrete source) I am curious if it works on 1.2M rows = FILTER ( ALL ( Products[ProductKey] ), [Total Margin] >= thisProductMargin )
I would not expect ALL(Products[Key]) to be any more performant than ALL(Products) given that the key is the primary key of the table. I could be wrong and am happy to be corrected by someone. The result will be the same. It would be possible to modify a pattern such as this one to solve the problem in a different way. https://www.daxpatterns.com/abc-classification-dynamic/ I can’t be sure if this would be more performant or not – my guess is yes. Also, most of the “cost” in your example would be doing the calc for the 80% of the customers you don’t need. You could try putting a visual level filter on the key based on sales/margin or what ever and just keep say the top 200k in you case.
Hi Danil and Matt,
I agree with Matt. I don’t think there will be any performance difference between having the table ‘Products’ or the primary key of the ‘products’ table as the argument; however, there is a semantic difference that will matter.
The measure :
FILTER ( ALL ( Products[ProductKey] ), [Total Margin] >= thisProductMargin )
will cross filter the [Total Margin] measure with values from the ‘products’ table if filters/slicers on some of the columns of the ‘products’ table’s filter domain exist ( e.g. subcategory, colour etc. ) whereas the expression from matt’s measure will not. If you want the exact same semantic behaviour as in Matt’s measure you’ll need to use this measure:
FILTER (
ALL ( Products[ProductKey] ),
CALCULATE (
[Total Margin],
ALLEXCEPT (
products,
Products[ProductKey]
)
) >= thisProductMargin
)
Jes.
Marco Russo is in Australia at the moment and he spoke at the Sydney Power BI Meetup tonight. I asked him specifically to confirm this point. He confirmed that there should be no material difference between iterating a primary key of a dimension table, or the dimension table itself.
Hi, did you find a solution to this memory issue? Thanks.