Just a short post today to share with you a permanent fix to something that has been annoying me (maybe you too – but then again I am easily annoyed 🙂 ). Edit: read the comments below from Amir Netz from Microsoft where he explains why this change was made
Vertically Position Report Canvas in Power BI Desktop
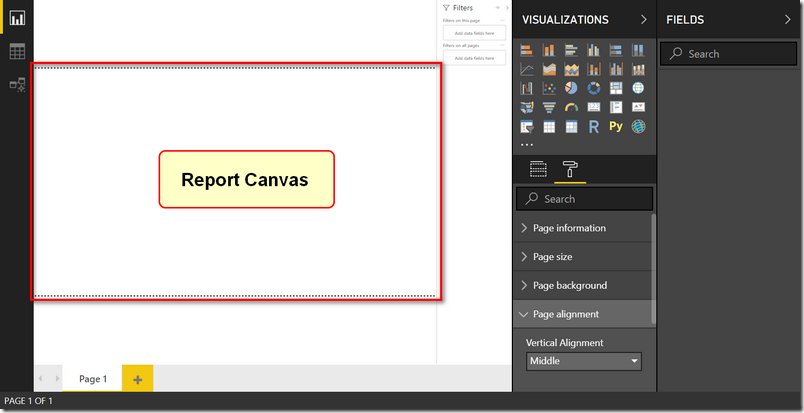
In one of the recent releases of Power BI Desktop, the Power BI team made a change that allows the report canvas to float to the top of the available space on the screen (see image below).
Since I have installed the April 2019 release of Power BI Desktop, I have noticed that every time I open a new file, the canvas seems to be this way. I guess the dev team changed the default – not sure. Anyway, after being annoyed for a few days, and manually changing the setting each time, I went searching for a permanent solution.
One Off Change
It is easy to change this setting for the current report. First make sure the canvas is selected (ie no visuals are selected), and then make the change in formatting as shown below.
After making the change, the report canvas is back in the centre.
Change the Defaults
There is a permanent way to make this change. Simply go to File\Options and Settings\Options and navigate to the Global Report Settings. From there you can permanently change the setting (just change the default shown in 2 below).
What Other Default Settings to You Want to See?
There are quite a few global default settings I would like to see added to Power BI Desktop. Things that can be changed already, but I want to change the permanently as my preferred settings. Here are some of them:
- Change the default font size.
- Turn off Auto Relationship creation.
- Turn off Auto Time Intelligence.
What about you? Do you have any default settings you want to see added to Power BI? Please share your comments below and I will compile a list and request the changes all at once.


MS should have an option to have the canvas to the top-left.
When you mix different pages (of diff sizes), having the option to always align to the top left is crucial.
For functionality/default… in a multi-select prompt, after you search for some value, having the ‘select all’ (that are returned with the search string) functionality would be helpful. Just like in Excel.
Thanks
MS should have an option to have the canvas to the top-left.
When you mix different pages (of diff sizes), having the option to always align to the top left is crucial.
Thanks
Thanks for the canvas positioning hint, that’s been a source of frustration for a while, especially when trying to compare output from 2 separate pbix’s.
What would I like to see,
1) The new filter panel being the same format (i.e. white on grey) as the Visualizations and Fields panels. In its current format, with a smaller font and grey on white, it’s difficult to read on some monitors, so much so that I end up disabling it.
2) A “Personal” PBI file (as in Excel’s Personal.XLS/x/m/b) to save default settings, themes or downloaded visuals, rather than having to keep setting/switching/re-downloading each time.
Hey Fred. You can change the filter pane from the May 19 update. Amanda has a blog with a sample json file.
This is a bug. It should be fixed with the latest version of the April 2019 desktop (note, sometimes there can be more than one version in a month, so download the latest)
Thanks this one has been bugging me.
How do you arrange the tables in the relationship view and get them to stay?
Default Word wrap being able to turn off
Being able to exclude a filter from the filter pane on report level, for a specific page. If you want a certain filter on every page, except for one, you have to manually put in every page, and doesn’t sinc. This is a sort of an exclusion from default..
Great initiative: default date format, default decimal number format with with thousands seperator and default digits behind comma), default background image setting (back ground image doesn’t copy, you have to import if for every page, would be great to set a default back ground image for every page.
Font size. Power Query formula bar on for new users. Power Query expand merged column “keep original column name” OFF – always ??. Drill down chart axis labels – Concatenate – OFF
I would like to see a global Filters pane format option rather than having to format the pane on each page.
Good point – I didn’t realise that was an issue because I haven’t ever edited this. Thanks for sharing
Hey Matt – there is actually some logic in the madness here.
The idea for the change was to ensure that the filter pane and the top of the page are aligned together. Otherwise the “Filters” string will show higher than the title of the page which creates an awkward look for the report consumers.
For report consumers, it often makes much more sense to see the content of the page align to the top of the screen rather than to the center of the screen. Aligning content to the top is the standard behavior of virtually every web site.
The top alignment in the desktop is admittedly kind of strange visually (especially when coming from PowerPoint) but remember that the consumers of the report will not see the dotted lines and all they will get is a nice top-aligned web page which is like any other web page they work with.
Amir.
Thanks for taking the time to share the back story here Amir.