The December 2020 version of Power BI desktop has just been released, and it is undoubtably the most important release since the first version way back in 2015. The super feature that has been released is an update to composite models using direct query of online datasets. The implications of this release are massive. Anyone with Power BI Desktop can now build their own, local version of a data model and enhance it with their own additional data without the need to have edit access to original data model. Oh, and it is a Pro feature, not a Premium feature!
Locally enhanced data models
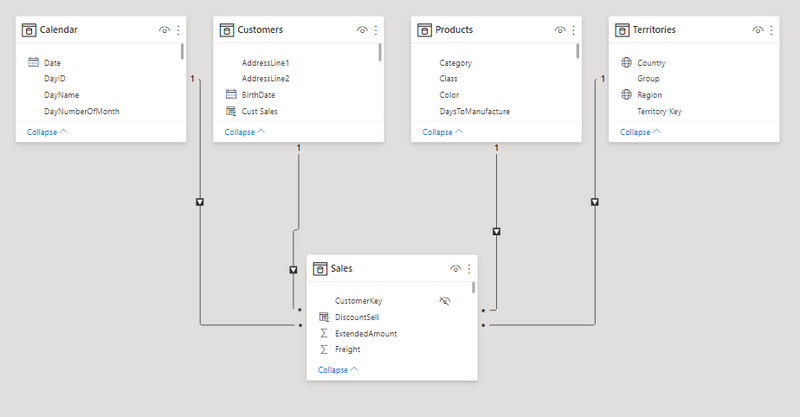
Let me give you an example using Adventure Works. Assume my standard Adventure Works database is built and maintained by IT (shown below). It is the one version of the truth and everyone relies on that data.
But I’m special; I have a need to do some analysis using some additional data as well as this main, published data model shown above. Let’s say I want to overlay my draft budget data for next year over the historical data and do some analysis before I submit the budget for approval. The budget data is not part of the data model (not yet, anyway). The way this problem has been solved (since 1985, anyway) is to click “export to Excel” and then mash the data together in Excel. With the introduction of composite models with direct query over online datasets, that has now changed, forever.
Budget Demo
This is a preview feature (as at Dec 2020), so you need to turn it on (#1 below). While you are there, make sure you turn on “small multiples” too (#2 below).

Once turned on, I can then create a new, thin workbook connected to a data model hosted at PowerBI.com (as shown below). Note, this must be a shared workspace. It does not work with “my workspace” with the implication that you cannot do this with a free account, you must have a Pro account.

And I can see the data model in the model view (shown below). What is new is that the data and query options in the ribbon are enabled.

In this demo, I want to combine my budget spreadsheet into the model, so I clicked on Get Data\From Excel. I was prompted with this message. I clicked “Add a local model”.

I selected my budget data to import, then got the following message.
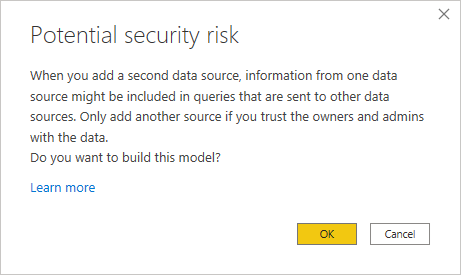
This makes sense. When ever you join data from different sources together, you create the potential that Power BI will send your data to the other source for the purpose of generating a query at the other source. This potentially exposes your new local data. I don’t think it is a big issue inside an organisation, but you should be aware.
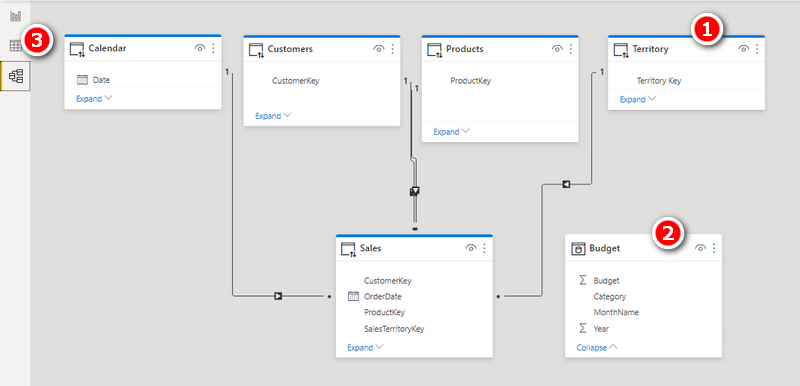
The new table was loaded. Note the colour coding below. Blue tables (ie #1 below) are part of the online dataset and the other one (#2 below) is my locally added file (Budget). Also note that the data view is now visible (#3 below).
When in the data view, you can only see the local tables (#1 below). You cannot see the tables from the dataset (#2 below).

I don’t know if this will change – I hope it will. If you can’t see what is in the columns of the online tables, it can be tricky to work out which columns to use for joins and also which columns to be used in your measures. It also means that you cannot add a calculated column to an online table. And you also can’t see the measure formulas. It is very hard to use measures as inputs to new measures in your local model if you can’t look at the formulas.
From here it is possible to build a bespoke version of the data model using the local data. I was able to add
- a new calculated table Product Categories = ALL(Products[Category]) so I could use it as a bridging table in my model (shown in #1 below, but be sure to read the last section about bugs too),
- a 1 to many relationship from this local bridging table to my local bugdet table (#2 below),
- a many to many relationship from my online calendar table to my local budget table (#3 below).

With the local model variations built, I could then set about building a report using the data from both sources.

A Few Bugs
At the time of writing, I noticed this message in the bottom right hand corner of Power BI Desktop. When I clicked it, nothing happened.
There were 2 other things I noticed. The formatting I had set on the measures on the online dataset did not flow through to the local model. I was able to format them again locally, however. Not ideal, but it worked. The other issue was that my calculated table in my model didn’t work. When I tried to use the Category Column from the bridging table, it simply didn’t work. You can see below that the calendar table is filtering the sales table, but the Category column from the calculated table is not.

I decided to test a local version of the data. I deleted the ALL(Products[Category]) local calculated table and loaded the data manually using Enter Data. This time it worked just fine.

Keep in mind this is still in preview mode, and some things still need some polish.
What do you think?
What do you think about this feature? Do you agree with me that it is game changing? How will you use this feature? Leave your comments below.
Thanks for sharing. I read many of your blog posts, cool, your blog is very good.
Your home is valueble for me. Thanks!…
Thanks for sharing. It’s first quality. http://www.01.com.hk/member.php?Action=viewprofile&username=Eamngq
You actually make it seem so easy with your presentation but I find this topic to be really something that I think I would never understand. It seems too complex and extremely broad for me. I am looking forward for your next post, I will try to get the hang of it!
buy generic xenical online – https://asacostat.com/# buy xenical 60mg generic
order generic dapagliflozin – https://janozin.com/# order dapagliflozin pills
This website positively has all of the low-down and facts I needed there this case and didn’t know who to ask. http://www.underworldralinwood.ca/forums/member.php?action=profile&uid=487613
This is the gentle of writing I positively appreciate.
https://doxycyclinege.com/pro/dutasteride/
The depth in this serving is exceptional. https://ondactone.com/product/domperidone/
Hi there, just became aware of your blog through Google, and found that it’s truly informative. I am gonna watch out for brussels. I’ll appreciate if you continue this in future. Lots of people will be benefited from your writing. Cheers!
online pharmacies canada
canadian rx pharmacy online
drugs online
canadian pharcharmy reviews
most reliable canadian pharmacies
non prescription medicine pharmacy
online prescriptions canada without
canada pharmacies online
canadian pharmaceuticals online
recommended canadian online pharmacies
cheap drug prices
I like this web blog very much, Its a rattling nice place to read and obtain info .
More delight pieces like this would urge the интернет better. fildena douleur
This is the kind of glad I enjoy reading. https://prohnrg.com/product/lisinopril-5-mg/
This is a keynote which is virtually to my fundamentals… Numberless thanks! Unerringly where can I upon the acquaintance details in the course of questions? https://ursxdol.com/azithromycin-pill-online/
Thanks recompense sharing. It’s top quality. sitio web
This website positively has all of the tidings and facts I needed adjacent to this subject and didn’t comprehend who to ask. amoxil online
cheapest viagra soft tabs – viagra 50mg price costco 100 mg of viagra
order ranitidine 150mg pill – https://aranitidine.com/# buy ranitidine 300mg sale
cenforce 50mg drug – buy cenforce 50mg order cenforce 100mg for sale
lexapro 10mg usa – buy escitalopram 10mg sale order escitalopram 10mg pills
buy fluconazole generic – https://gpdifluca.com/# fluconazole 100mg us
Hmm it seems like your website ate my first comment (it was super long) so I guess I’ll just sum it up what I had written and say, I’m thoroughly enjoying your blog. I too am an aspiring blog writer but I’m still new to the whole thing. Do you have any recommendations for novice blog writers? I’d certainly appreciate it.
When I initially commented I clicked the “Notify me when new comments are added” checkbox and now each time a comment is added I get several emails with the same comment. Is there any way you can remove people from that service? Thanks a lot!
Enjoyed reading through this, very good stuff, thankyou.
Lovely site! I am loving it!! Will be back later to read some more. I am taking your feeds also.
Does your site have a contact page? I’m having a tough time locating it but, I’d like to shoot you an email. I’ve got some creative ideas for your blog you might be interested in hearing. Either way, great site and I look forward to seeing it grow over time.
I was wondering if you ever thought of changing the layout of your blog? Its very well written; I love what youve got to say. But maybe you could a little more in the way of content so people could connect with it better. Youve got an awful lot of text for only having one or 2 pictures. Maybe you could space it out better?
I think this internet site holds some very wonderful information for everyone : D.
whoah this weblog is wonderful i like studying your articles. Keep up the great paintings! You already know, lots of individuals are looking around for this info, you could aid them greatly.
Thank you for your sharing. I am worried that I lack creative ideas. It is your article that makes me full of hope. Thank you. But, I have a question, can you help me?
I can connect easily to the online dataset but I need to transform data from one of the tables and I cannot figure out how to do that in Power Query. Is there a way to transform data from an online dataset?
no there isn’t. The point of this feature is to leverage data already prepared in a different model without manipulation.
Hi Matt
Thank you for valuable information,
I’ve recently applied this method, and it works properly on desktop version, however when goes to cloud need gateway arrangement.
The other issue for me is, how can I revert back and delete the imported query from my dataset again?
Kind regards
using this approach should not impact the need for a Gateway
This is awesome but even though I have the last December update and I enabled the DirectQuery option for Power BI datasets and Azure Analysis Services, I do not have the data and query options in the ribbon enabled.
Could you help me how can I enable this new work option?
I can only guess. Are you signed in to Desktop with a pro account?
Hello Matt,
https://docs.microsoft.com/en-gb/power-bi/connect-data/desktop-directquery-datasets-azure-analysis-services
Regarding calculated tables there is a limitation:
“Some queries may return wrong results when there’s a relationship between calculated tables and table(s) in a remote source. Creating calculated tables over a remote dataset isn’t supported, although it isn’t currently blocked in the interface.”
I think that is a problem you encountered.
You are correct. MS confirmed this to me too. Thanks for sharing.
As there is a very big hype about “composite”, I set some opposed aspects, to maybe balance this discussion, as many user will demand this feature immediatly without evaluating.
http://blog.dataengineer.at/en/composite-ist-da-vorsicht/
I don’t think the fact that people can build poorly performing models is a disadvantage of the capabilities. I have seen plenty of bad Tabular models well before this feature was released.
You are absolutly right with that, but it is not only about performance, was just an example for the fact that now there a two technologies joined which are not “naturally” fit together, means that there always will be some kind of work around to connect these two worlds in the automatically built query statement, kind of unpredictable magic.
And just to point this out: The weired result was not of an poorly designed model, but of a perfect designed model!
A classic 1:n relation between dimension and fact with an integer key.
yeah this is a nice feature for lots of work, a big change after a huge break.
Thank you Matt for an insightful article as always. I forwarded a copy of this to our IT management. Your budget example is spot on perfect case study!
I remembered seeing this in preview some months ago at the Biz Apps Summit. From a self-service user point of view, the ability to add in your own data from another source not in the IT-maintained golden set is game-changing. Both this blog and Guy in a Cube’s recent video don’t seem to mention it, but I just tried it: you can also directly query multiple published Datasets, see their constituent tables and connect them together. This makes the new feature game-changing for the developers of those IT-backed enterprise-grade Datasets too, adding another aspect for consideration in to their designs.
Yes, you are right Lee. I didn’t cover this as I wanted to keep it simple and focused on how I think many of my users will be able to benefit. Joining different models is also possible, and while it sounds like it will add value, I am not so sure of the use cases just yet.
I currently import all my 3PL warehouse bills via power query and check them there by linking in actual Salesforce delivery and order handling data and product data (carton dims etc) About 8 internal tables added and much transformation needed. It just repeats building that has already been done in my main power BI dataset so now I think I can just bring that pbi dataset in to the 3PL model rather recreating all that work? Is that the sort of thing we are envisaging here?
Sounds like a good use case to me.
Really revolution. You are allowed to use same dataset in different production lines relating to different staff.
What about calculation speed? Is it faster to save different file for two different line production or this way?
Thanx for your fantastic work!
There will definitely be a performance hit, but I guess that will depend on the data and also the visuals you build.
Absolutely breakthrough feature and super excited, waited for it since first demo in April. Hopefully, Microsoft will polish it pretty fast as it has quite a few of bugs.
Been waiting eagerly for this. Game changer !!
agree its amazing !
100% this is a game changer. The whole point of self service BI is to take the data and enrich it with the parts that IT hasn’t included, allowing you to answer the question du jour. My big hope is that they will eventually bring this back to Excel as well. 😉
“My big hope is that they will eventually bring this back to Excel as well.”
Who will then pay 10$ per user per month ? – No, they will continue to keep the Mashup engine and the Vertipaq Engine in Excel at least a generation behind Power BI Desktop
The effectively killed the visualization story in Excel after not moving forward with the Custom Visuals.
I don’t think it will ever come to Excel, and I would be very surprised if Power Pivot for Excel is ever updated again. The PQ version in Excel is quite recent and I’m sure it will continue to be updated promptly.
Considering that you need a $10 per month Power BI Pro license to read from this… I think it makes a pretty compelling reason for a large portion of Excel users to get on board. I’m fully aware of how far behind Power BI Excel’s data model is, but still hold out hope that it will get revved and eventually catch up. If they can do it with Power Query, they can do it with the data model. They just need to want to do so.
I also thought it may happen (power pivot will be fixed), until my podcast with Rob Collie a few weeks ago. https://exceleratorbi.com.au/crossover-day-matt-allington-rob-collie-podcast/
You can listen to the entire episode, but I think the relevant part starts as 48:50