Why Star Schema Matters More Than Ever in the Age of AI
It was over a decade ago that Matt first posted on The Optimal Shape for Power BI Data. Throughout the years since, Matt consistently promoted this as one of the most important lessons he taught Power BI users : the shape of your data matters. Not just a little—but fundamentally.
Back in 2015, the focus was mostly on helping humans analyse data more easily: faster reports, simpler DAX, and fewer modelling headaches. Today, that same principle has taken on a new level of importance.
Why?
Because your data model is no longer consumed only by report authors and dashboard users. It is increasingly consumed by AI.
As organisations shift from traditional “analyst-driven” reporting to AI-assisted (and increasingly AI-led) analytics, the quality of your model’s structure directly affects whether AI gives accurate, consistent answers, or plausible-sounding nonsense because the model’s meaning is ambiguous.
Whether it’s Copilot in Power BI, AI-assisted insights in Fabric Data Agents, or other natural language Q&A layered on top of your reports, your data model has become the semantic foundation that AI relies on. And just like humans, AI performs best when the underlying structure is clear, consistent, and predictable.
In other words:
A Star Schema isn’t just a performance pattern anymore—it’s an AI reliability pattern.
That’s why the Star Schema is more important than ever.
What do we mean by “shape”?
When we talk about the shape of data in Power BI (or Semantic Models), we’re talking about things like:
- How many tables you load
- How many columns are in each table
- Which columns belong in which table
- How tables are related (and how filters flow)
- Whether your data is pivoted or unpivoted
The key thing to understand is this:
The shape of data in transactional systems is almost never the optimal shape for analytics.
Operational databases are designed to capture events safely, accurately and efficiently. Analytic models need to summarise, filter, and explain those events—often at high speed, and now often via AI-driven interactions.
Historically, enterprise BI teams handled the reshaping step behind the scenes. But modern self-service analytics—and now AI tooling—means YOU often own the semantic layer, and the semantic layer is what AI “reads.”
Simply importing source tables “as-is” into Power BI is rarely the right approach.
The Star Schema is still the optimal shape (and now it’s AI-optimal too)
The generally accepted best practice for modelling data in Power BI is the Star Schema, a concept from dimensional modelling (often associated with the Kimball methodology).
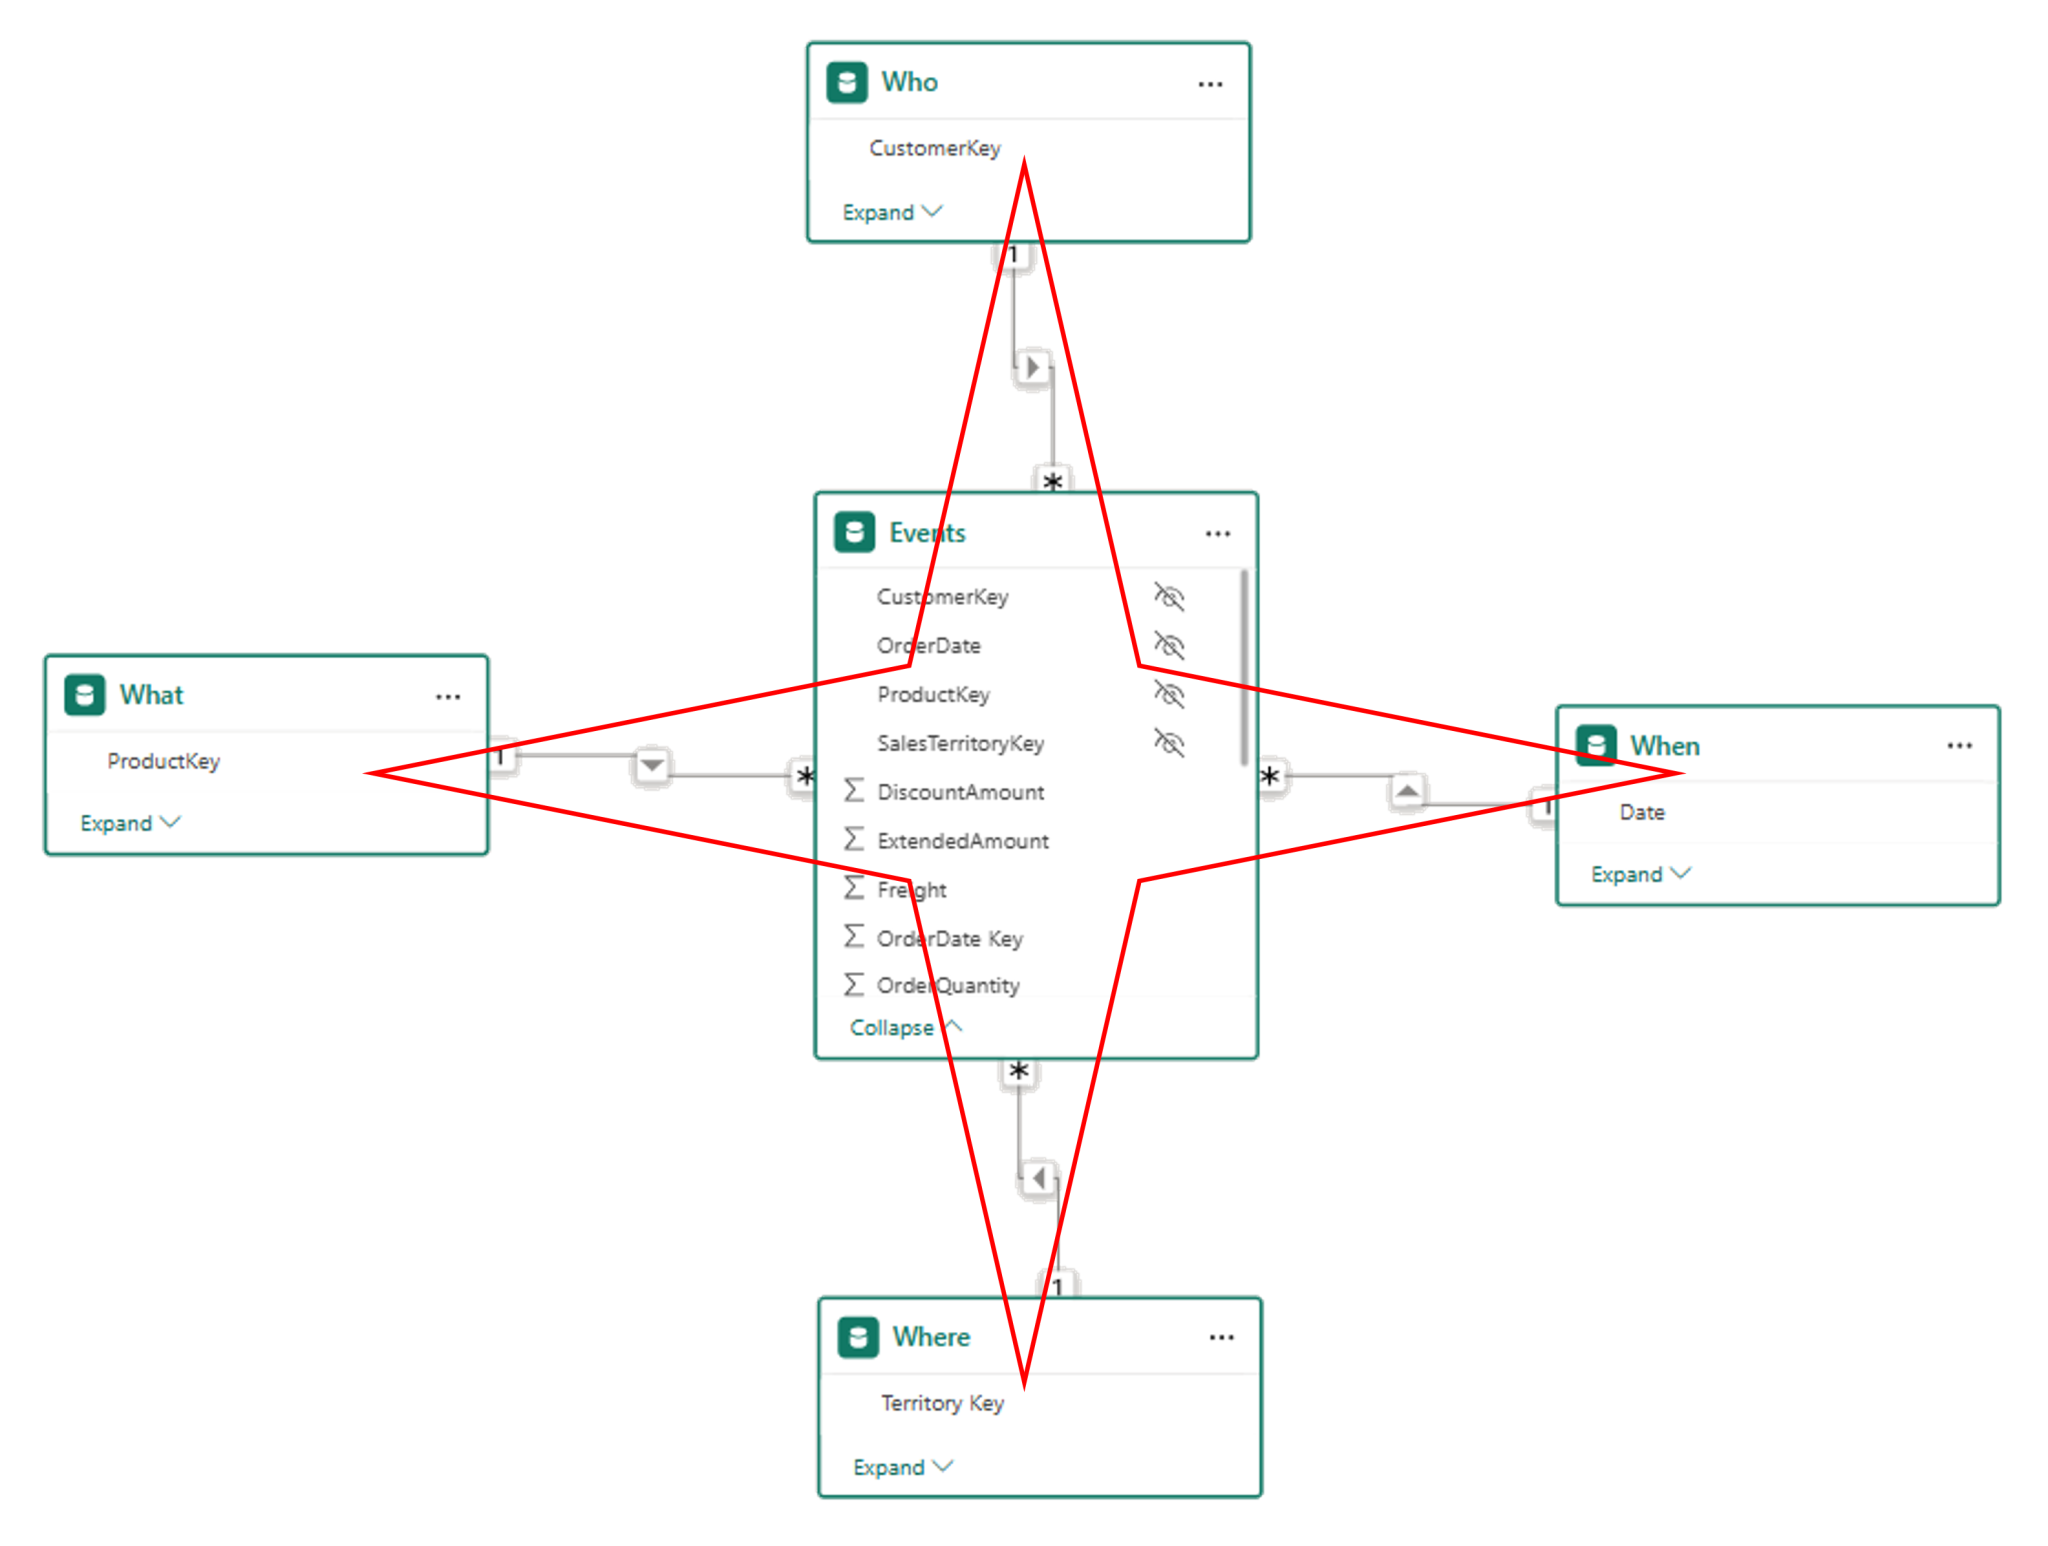
At a high level, a Star Schema consists of:
- One or more fact tables in the centre (the “events” or “transactions”)
- Multiple dimension (lookup) tables surrounding them (the “things you describe and filter by”)
It’s called a “star” because of the way the relationships radiate outward from the fact table.
While the term may sound technical, the idea is actually quite intuitive—and maps closely to how Excel users have thought about data for years.
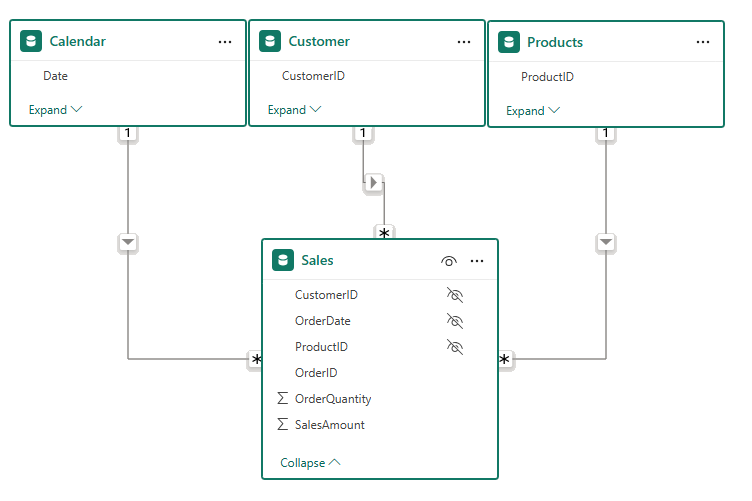
The Collie layout (a practical twist)
When teaching Power BI skills, I strongly recommend a visual layout popularised by Rob Collie:
- Dimension (lookup) tables at the top
- Fact (data) tables at the bottom
Logically, this is still a Star Schema—the layout simply helps you see it more clearly.
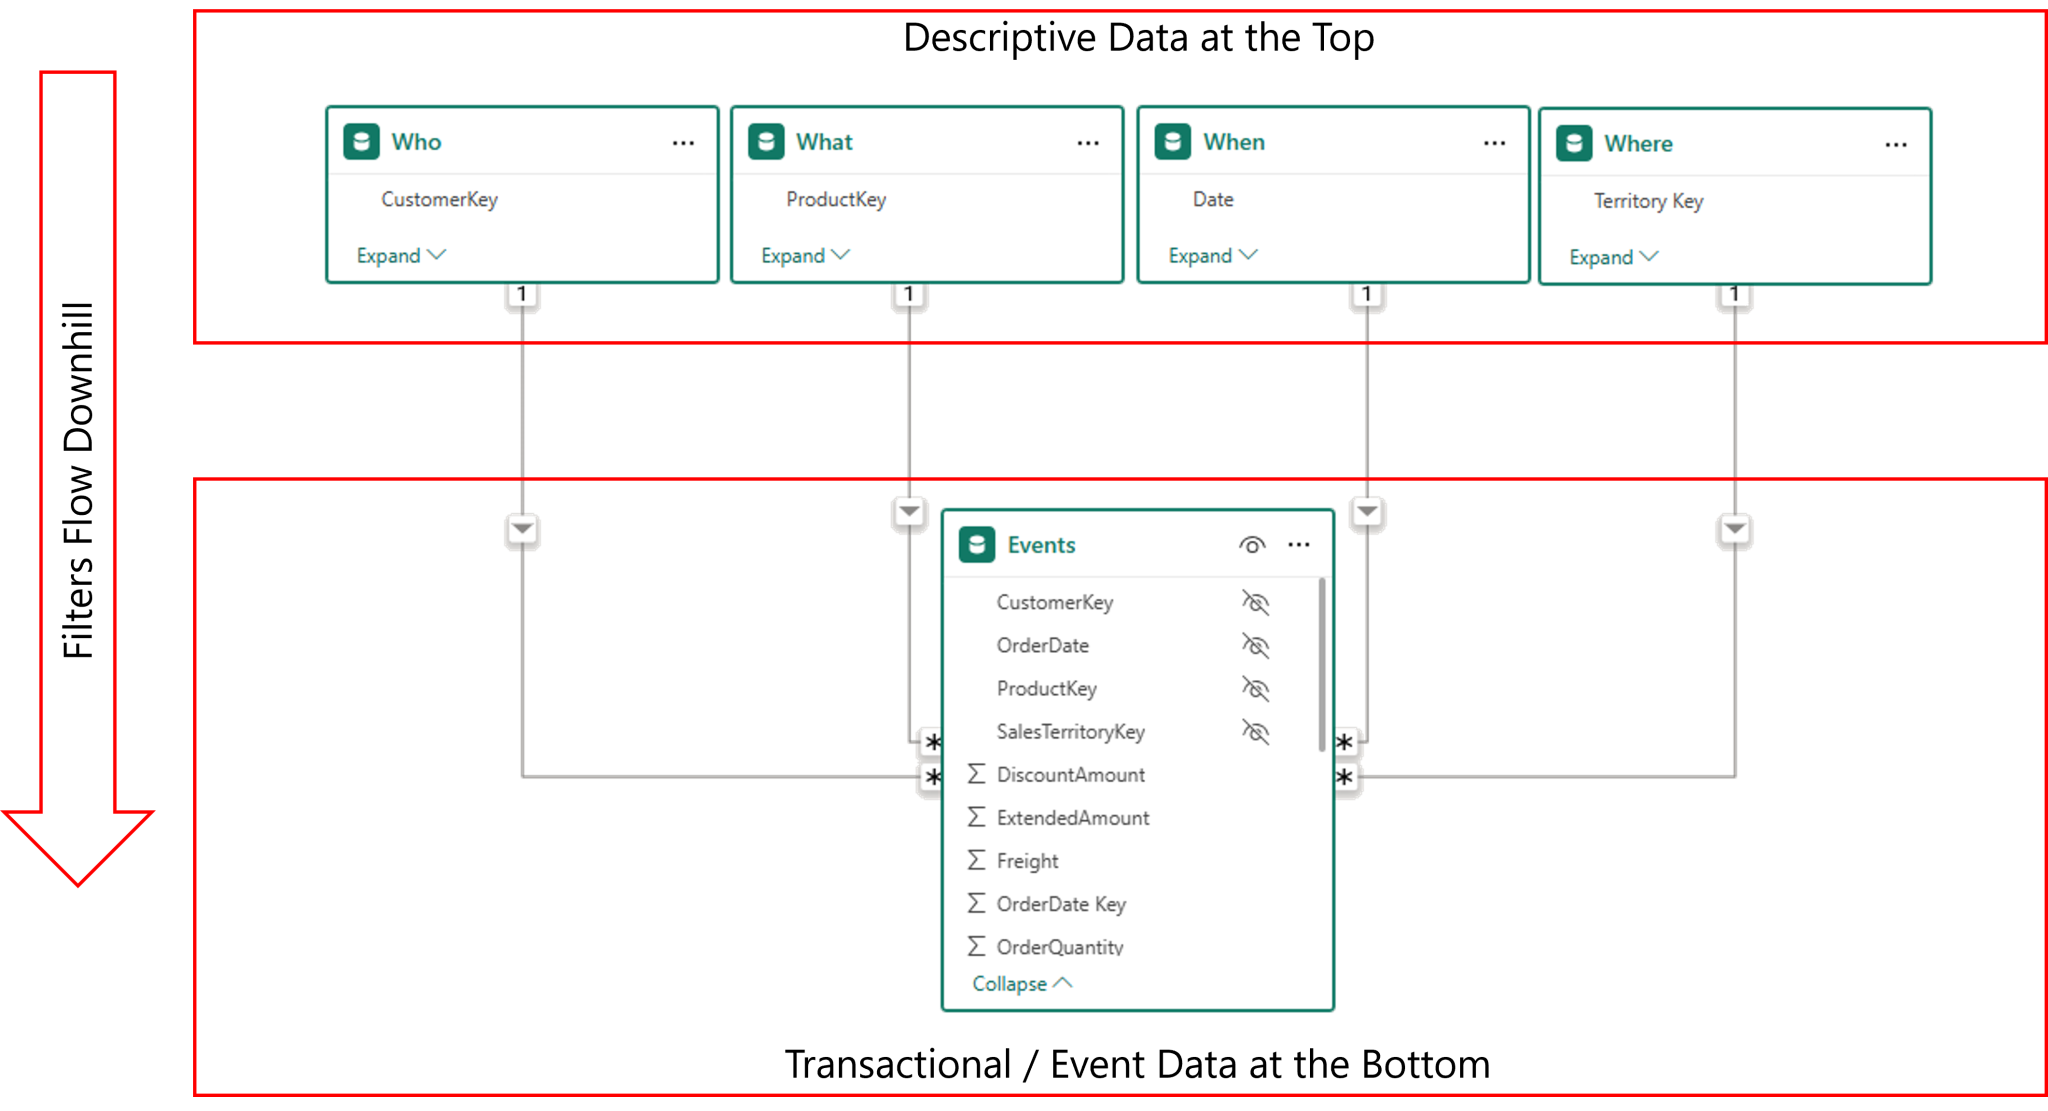
This approach reinforces three important ideas:
- The tables at the top are the ones you “look up” to understand and filter your data
- In Excel, these are the tables you would once have pulled into one flat table using VLOOKUP
- Filters flow from top to bottom, like water flows down a waterfall — from the 1-side (dimensions) to the many-side (facts).
That last point matters for performance, correctness, and now also for AI-assisted analytics.
Dimension tables (a.k.a. lookup tables)
A dimension table, the nouns of your model, represents a real-world object you want to analyse by.
If you are unsure about where a column of data belongs, then the basic benchmark to measure it against, if the column describes the data, then it is dimensional data, and most likely belongs in a lookup table. Common examples of dimension tables answer questions regarding who, what, where and when (these are not the only dimensional entities, but is a good place to start if you are still learning). Examples include:
- Customers (who)
- Employees (who)
- Products (what)
- Calendar (when)
- Sites (where)
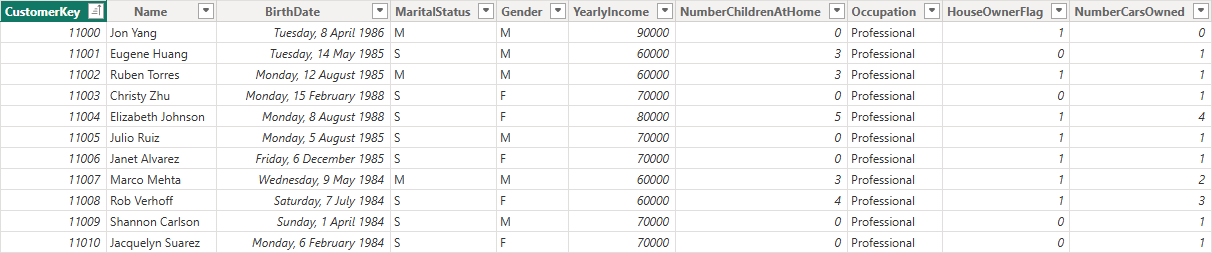
The defining rule: A dimension table must contain one and only one row per unique entity.
In the example of a Customers dimension, your Customers table should contain exactly one row per customer, with columns describing that customer in ways you wish to analyse your events, such as Customer Name, Segment, City, State, Industry, Occupation, and Gender.
No duplicates. No multiple meanings. One row = one customer.
This rule is critical not just for DAX correctness, but also for AI interpretation. If duplicates exist, your model becomes ambiguous. If the model can’t clearly identify what a customer is, AI tools will struggle to answer accurately because “Customer X” doesn’t mean one thing anymore.
Fact tables (a.k.a. data tables)
Fact tables contain the events or transactions you want to analyse.
Examples include:
- Sales transactions
- Shipments
- Website sessions
- Support tickets
- Inventory movements
- Recruitment events
A fact table usually contains:
- Foreign keys that match to each related dimension
- Numeric values that can be aggregated (e.g. Sales Amount, Quantity)
When modelling your data, the aim is to achieve long, thin fact tables. There may be need to keep some descriptive information directly in the fact table, such as when there is no model efficiency gained by splitting the data into a dimension, but the aim is to keep this to a minimum.
The ideal shape of a fact table:
- Many rows
- Few columns
- Minimal repetition of descriptive attributes
This reduces model size, improves compression, and makes calculations easier and more reliable. Fact tables can be very large—millions or even tens of millions of rows—but remain fast and efficient when modelled correctly.
A simple before-and-after example
Let’s make this concrete.
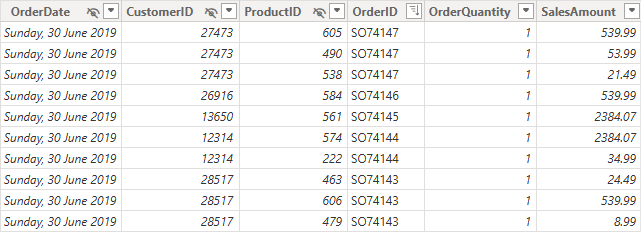
❌ Before Modelling: a flattened, transactional-style table
Many self-service models start life as a single wide database extract table like this:
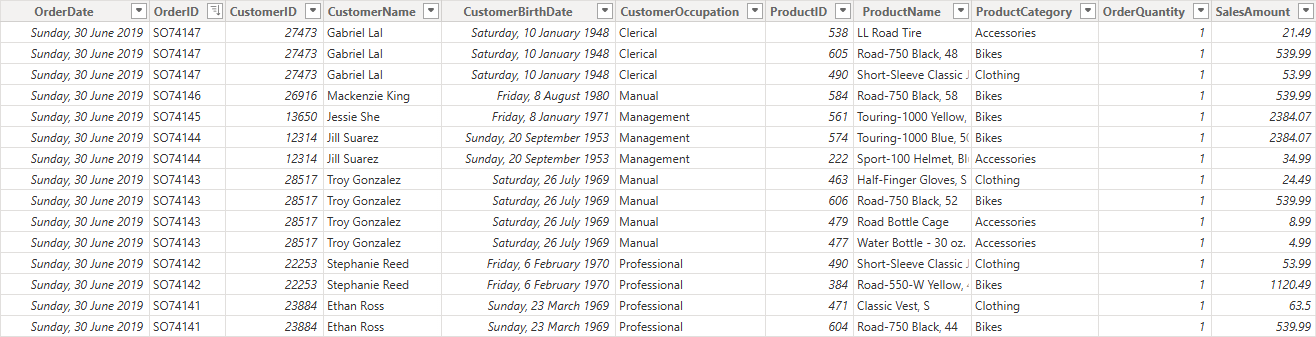
SalesData
- OrderDate
- OrderID
- CustomerID
- CustomerName
- CustomerBirthdate
- CustomerOccupation
- ProductID
- ProductName
- ProductCategory
- Quantity
- SalesAmount
At first glance, this feels convenient. Everything is “in one place”.
But there are problems:
- Customer and product details are repeated thousands of times
- Changes to customer attributes can create ambiguity
- Time intelligence becomes harder
AI tools have multiple places to infer what a “customer” or “product” means, which leads to ambiguity, and in turn leads to incorrect analysis results.
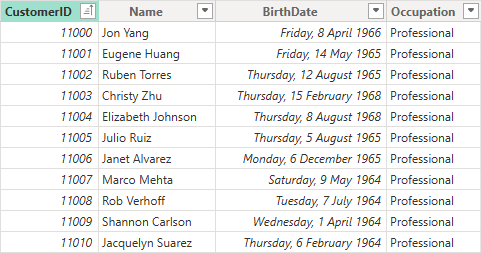
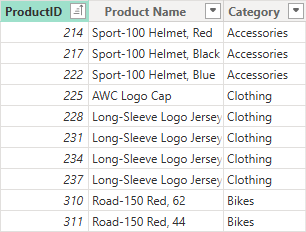
✅ After Modelling: a Star Schema
The same data reshaped properly:
Sales (Fact Table)
- OrderDateKey (Hidden)
- CustomerKey (Hidden)
- ProductKey (Hidden)
- OrderID
- OrderQuantity
- SalesAmount
Customers (Dimension)
- CustomerID
- Name
- Birth Date
- Occupation
Products (Dimension)
- ProductKey
- Product Name
- Category
Calendar (Dimension)
- Date
- Year
- Month
- Quarter
Now:
- Each descriptive concept has a single, unambiguous home
- Descriptive attributes are stored once, not repeatedly
- Filters behave predictably
- Measures are easier to write and reuse
- AI has a clearer semantic structure to work with
Same data. Vastly different outcomes.
Why Star Schema matters even more in AI-assisted analytics
As organisations adopt AI-driven features such as Copilot, Claude or any of the thousands of other generative AI Large Language Models (LLM) that exist, natural language queries are driving automated insights, and these insights are built upon the “language” AI uses to understand the business. That language is your data, and the Semantic Model is one of the best ways AI can understand your data, because it contains more than just tables of values. It contains relationships that determine how the tables impact one another, it has natural language descriptions that explain what the various data fields are used for, and synonyms that explain nuanced local lingo that helps the AI understand concepts like POs = Purchase Orders.
1) AI needs clear semantics, not clever shortcuts
When humans build reports, they can sometimes “work around” a less-than-optimal model (with extra DAX, weird relationships, or duplicated attributes). AI tools typically can’t do this.
AI performs best when:
- there’s one obvious place to find a concept
- relationships are consistent and predictable
- measures are defined once and reused
The Star Schema helps in this because it enforces a stable, readable structure:
- Dimensions define meaning
- Facts define events
- Relationships define how meaning applies to events
2) Natural language Q&A depends on unambiguous models
As organisations rely more on natural language (“What were sales in Brisbane last quarter?”), your model must support:
- consistent interpretation of terms (“sales”, “customer”, “quarter”)
- predictable filter behaviour
- clean hierarchies (e.g., Date → Month → Quarter → Year)
A star schema reduces the number of competing paths AI could take to answer a question. Fewer paths = fewer wrong answers.
3) AI-generated measures (and explanations) improve with clean modelling
When AI suggests a measure, it usually:
- infers intent from table/column names
- assumes standard relationship patterns
- tries to apply filters through dimensions
If your model is a star:
- measures are easier to generate correctly
- time intelligence is more reliable
- explanations are clearer (“filtered by Product Category, aggregated Sales Amount”)
4) Star Schema is the foundation for a trustworthy “metrics layer”
Whether you call it a semantic model, metrics store, or governed layer—AI analytics needs a place where definitions are consistent:
- “Revenue” means one thing
- “Active Customer” means one thing
- “Churn” means one thing
The Star Schema encourages the discipline of centralised definitions:
- facts hold raw numbers
- measures enrich the raw numbers and express the business logic
- synonyms ensure business terminology matches descriptive attributes
- dimensions provide consistent slicing
5) Performance still matters—especially when AI increases query volume
AI-driven interactions can mean:
- more ad-hoc questions
- more exploratory slicing
- more queries per user session
A star schema remains one of the simplest ways to preserve performance while scaling usage.
In short, a star schema lowers the cognitive load for humans and improves the semantic load for AI.
The Star Schema helps because it reduces ambiguity in meaning, creates consistent paths for filtering and aggregation, makes relationships explicit and predictable, and supports explainable, trustworthy metrics.
Naming conventions: now it’s not just for you—it’s for AI too
Good naming has always made DAX easier. But with AI, naming is a direct input into how AI interprets your model.
Table names
- Use clear business terms
- Avoid cryptic abbreviations and technical artefacts
- Prefer simple single noun names where possible: Pricing rather than Pricing_History_Sum_Tbl
- No spaces in Table names, use CamelCase if necessary: SalesOrders rather than ‘Sales Orders’
Extra AI tip:
If the business uses a term consistently (“Bookings”, “Billings”, “Revenue”), name tables and measures to match those terms. AI performs better when terminology matches what users ask. Take advantage of synonym definitions when these terms are difficult to align precisely with the data, or when there are multiple terms used for a common attribute.
Column names
- Spaces are fine when naming columns, because [Column Names] are always identified in brackets when being used in DAX formulae.
- Keep names short but meaningful: Customer Segment beats CustSegCd
Measure names
- Always use spaces (readability matters)
- Avoid CamelCase
- Match business language wherever possible
- Use clear prefixes and suffixes only when helpful (e.g., Total Sales, Sales YTD, Sales (All Products))
Clear naming improves:
- DAX readability
- User understanding
- AI’s understanding
AI benefit: consistent measure naming increases the chance AI will select the right measure when answering questions.
A final word on shaping
A Star Schema is not the only possible shape. Snowflake schemas (where dimensions link to other dimensions) can work, and sometimes are necessary.
But be mindful, every extra relationship introduces:
- Additional complexity
- Potential performance costs
- Increased confusion for users
- Greater risk for AI misinterpretation and halucination
Snowflaking can be justified (e.g., shared hierarchies, normalised master data), but if your goal is AI-ready analytics, prioritise clarity and simplicity. Your default position should be to flatten dimensions where practical.
When in doubt, simpler and clearer wins.
Key takeaways
- There are two types of tables: facts and dimensions
- Dimensions describe things you slice and filter by (one row per entity)
- Facts record the events you analyse (many rows)
- A Star Schema remains the optimal analytic shape
- In the AI era, your semantic model is no longer just for reports—it’s for machines too
If you want accurate insights, faster performance, and trustworthy AI-assisted analytics, start with the right shape. A Star Schema with clean dimensions, lean facts, clear relationships, and human-readable naming.
Your semantic model is the “data language” AI uses. Star Schema makes that language clearer, more consistent, and more trustworthy.
The Star Schema hasn’t become less relevant as we embrace the power of Artificial Intelligence.
It has become foundational.