Level: Intermediate
I got my haircut today (pretty spiffy one too, even if I do say so myself). While I was chatting I asked my hair dresser “on average, how often should I get my hair cut”? She told me (for men) around 4-6 weeks. Then I got thinking (as I do), I wonder if I could data-mine my credit card data using Power BI and find out how often I actually get my own hair cut. It turns out I was able to do this, and this article explains the hardest part of that task – find the number of days between two transaction dates using DAX.
Loading Credit Card Data
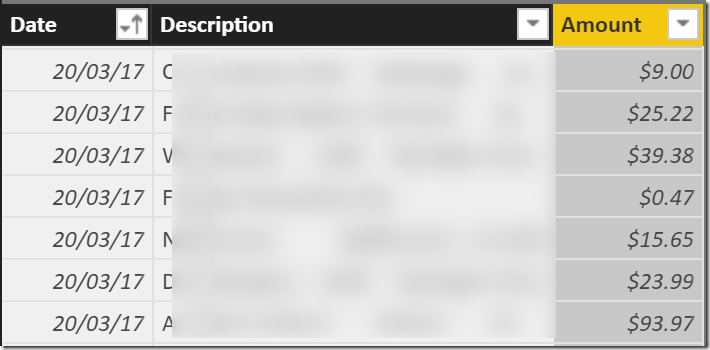
I have covered how to load your bank data using Power Query before so I am not going to cover that in any depth in this article. I first updated my bank credit card extracts so I had a full set of data and then loaded them up into Power BI. After loading the data into a single table, I had the following data structure.
As you can see, it is a simple list of transactions with a date, description (vendor), and the amount of the transaction. With this in mind, my idea was to first filter the description to that of my hairdresser and then find out the number of days between transactions. Note, I changed the true name of my hairdresser in the data extracts
Check the Data are Complete
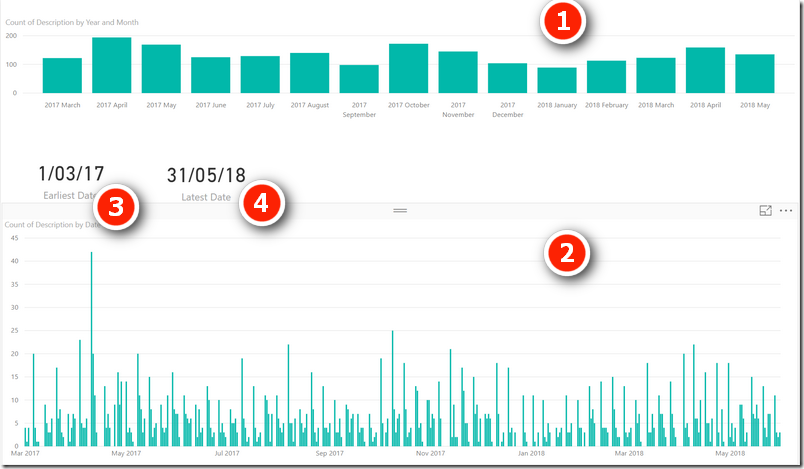
The first thing I did was use Power BI to check that the data were complete. It is not necessary to write any DAX to do this. I just created a couple of visuals that showed me a COUNT of description by date.
Visual 1 is simply the date column with a count of description. Power BI automatically creates a hidden date table that allows me to view the data by year and month. I actually deleted the Quarter and Day levels in this visual and then drilled down to Year\Month.
Visual 2 in the original report above is the same data but not using the date hierarchy, but using the actual dates of the transactions (posting date actually). I also created a couple of cards (3 and 4 above) and used these to find the first date and last date in the selected period. That allowed me to click on each month and check that the first and last date in that month seemed to be complete. Simply using this audit report allowed me to find some missing data in my csv extracts before I started the exercise.
Days Between Two Transactions
OK, next job was to filter for my hairdresser and look at the transactions in a table. You can see a slicer on the left below and the table of data on the right. Mmmm, seems my hairdresser put up the price 3% in April this year!
The task at hand is to find out the number of days (or weeks) between each of these transactions. This is easy in Excel because a spreadsheet has a cell reference, and you can copy formulas and maintain the relative relationship between the cells. This is not possible in Power BI, Power Pivot or any database for that matter. Databases do not store data using absolute location references – they simply store the data in the most efficient way it can and the order is not reference-able (unless you have a row ID, and that is not a good idea in Power BI).
Days Since Previous Transaction
As is my style, rather than me give you the answer, I want to show you how I solved the problem. It is always best to set up a table (or matrix) and solve each part of the puzzle one step at a time. EVERYONE does this in Excel automatically, but it is not so intuitive in Power BI. You should ALWAYS solve problems this way in Power BI.
Extract the Correct Date of THIS Transaction
The first task is to be able to access the date of the current transaction. For this formula, I decided to use the VAR syntax. So my first WIP measure was as follows:
WIP = VAR ThisTranDate = SELECTEDVALUE('Visa Extracts'[Date])
      Return ThisTranDate
When I placed this measure in my table, this is what I got – confirmation that the measure is correctly identifying the current transaction date.
Date of Previous Transaction
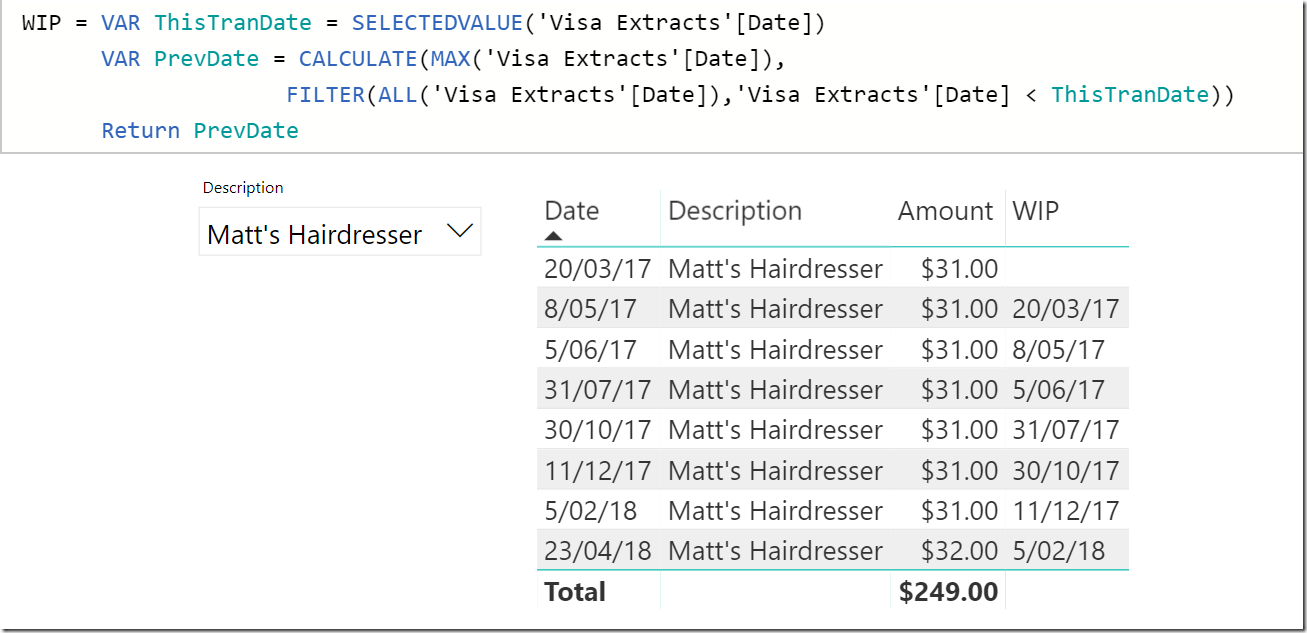
There are 2 benefits of creating a table and placing your WIP measure in that table. Firstly you get to see if the measure is giving you the answer you expect, and secondly being able to “see” the problem in front of you helps you think through the next steps. As I said earlier, it is not possible to use a cell reference in Power BI. The only way to solve problems like this in DAX is to first filter the data and then act on the data that has not been filtered (Filter First, Evaluate Second). If you look at the table above, you will “see” that the way to solve this problem is to filter out all records that occur on or after the current transaction date and then work out the latest date.
Note: This works because I know I don’t have more than 1 transaction for my hairdresser on the same day. If there were more than 1 transaction on the same day, you would need some way of determining the order of transactions within the same day, such as a time stamp or an ordinal ID of some type.
So my job to find the previous transaction is simply to use FILTER to find the last record AFTER filtering away the current and all future transaction dates. I modified my WIP formula as show below (there are other valid formulas that will work too). Note how the FILTER function first removes all the transactions on or after the current transaction, then returns the last date left in the list, which just happens to be the date of the previous transaction.
Days Between Transactions
Now that I had the current and previous dates, I was able to find the days between each transactions. Here is my formula:
Weeks Between Transactions =
      VAR ThisTranDate = SELECTEDVALUE('Visa Extracts'[Date])
      VAR PrevDate = CALCULATE(
                        MAX('Visa Extracts'[Date]),
                        FILTER(ALL('Visa Extracts'[Date]),'Visa Extracts'[Date] < ThisTranDate)
                     )
      Return DATEDIFF(PrevDate,ThisTranDate,DAY)/7
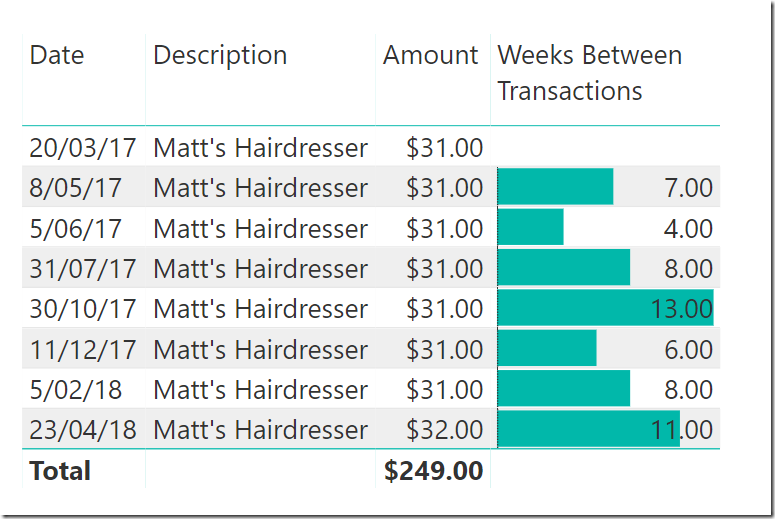
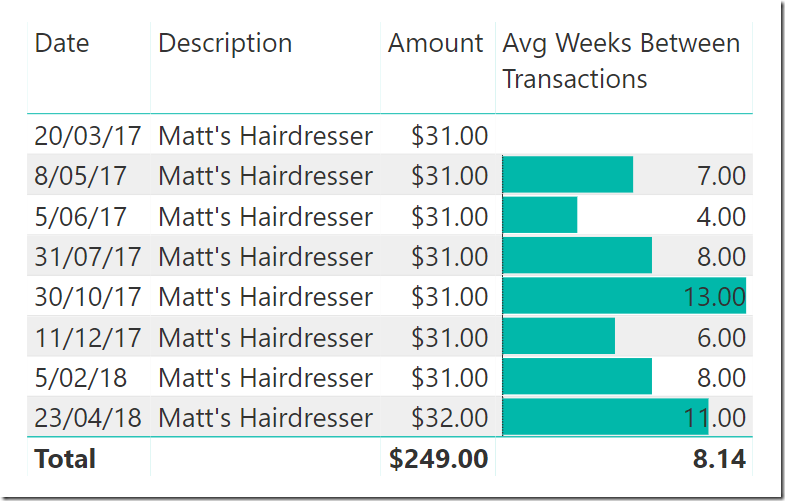
As you can see below, this formula gives me the weeks between each transaction, but it doesn’t give me an average overall.
Average Days Between Transactions
This is where experience comes in. I knew immediately that the way to find out the average over all the selected transactions was to write an AVEARGEX function that iterates over the dates in the Table visual to create the answer. In other words, I needed to write a measure that would “simulate” the role of the table above and work through each transaction one at a time, then work out the average overall. I talk about this “simulate” concept in depth in my article here. Because of the way filter context works (the filter coming from the table visual), it turns out that this new AVERAGEX measure will work equally well for each row in the table as well as the total in the table.
As a result, I then removed my first measure and was left with the following:
Wrap Up
Any analysis is only as good as the data you have loaded. I would actually be surprised if I went 13 weeks without a haircut and think that I may have paid for my October 2017 haircut with cash (rare, but possible). As it turns out, if I assume there is a missing haircut between July and October, then my average is 6.33 weeks. I calculated that using this formula.
Avg Weeks Between Transactions =
    SUMX(VALUES('Visa Extracts'[Date]), [Weeks Between Transactions])
    /
    (DISTINCTCOUNT('Visa Extracts'[Date]) + 1)
Disturbing Open Questions
This article creates a whole lot of disturbing questions that are out of scope for this article, such as “Does Matt really spend more $30 for a haircut”, and “What happened in early June 2017 that triggered a hair cut after 4 weeks”?






Please note the results was wrong it didn’t gives any results
Thank you, you helped me solve a problem at work! Now I get the days between cleanings of filters in the table, but is there a way to be able to use this in a scatter chart? I want to look at the correlation of time between cleanings and cleanliness score you see.
Sorry, i don’t understand. The best place to ask for specific help is at community.powerbi.com. You should post a clear question explaining what you want to do
It looks like you’ve got a photo missing of a formula for step three to get it to calculate days/weeks between?
Hi Matt good explanation I have followed your method but want to extend on it. I have a record of injuries from multiple sites I want to be able to see the number of days between injuries for all sites or for a selected site. When I select a specific site it looks like the measure is continuing to use ALL records in the calculation. When I remove the ALL from the FILTER the PreviousDate col remains Null. Is there a way to modify the FILTER(ALL statement to acheive my aim?
I’m sure there is a way, but it depends on your table structure. Best path to get help is to create a small sample workbook with non sensitive realistic data and post a question on a forum, such as community.powerbi.com or powerpivotforum.com.au Feel free to email me a link to your post and I will look when/if I get a chance.
I got it! In case it’s helpful, I just added this to the PrevDate variable:
FILTER(ALL(‘Visa Extracts’)’Visa Extracts'[Description]=SELECTEDVALUE(‘Visa Extracts'[Description]) && ‘Visa Extracts'[Date]>ThisTranDate
Thanks, Matt! You got me 2/3 of the way there with a problem I’m facing. Is there a way to nest the filter context into the DAX so that I can calculate something like “Average Days between transactions for the same vendor” in a single measure? I’m looking for something where the Previous Date measure could be on a visual with all descriptions being shown and it only grabs the previous date where the description matches. Thanks for any help you can give to get me down the road on this one!
Great post. I enjoy the way you broke down the problem and iterated towards the solution.
Great article!
Matt, what happened in early June 2017 that triggered a hair cut after 4 weeks?
From memory it was getting ready for the Microsoft Data Insights Summit 🙂
Pretty much any hairy problem can be solved in DAX, eh?
Nice work, but for a pro level question, how about average work days between transactions? Something like the Excel NETWORKDAYS or NETWORKDAYS.INTL functions?
Also, will we see you in Seattle at the end of July?
Hi Matt. For working days, have a read of my article here https://powerpivotpro.com/2016/12/how-many-working-days-has-an-employee-been-off-work/
Yes I will be in Seattle. Come and say hi.
This is great, thanks Matt.
Nice step by step process. This really helps with understanding filter context.
Hi Matt, very nice article. I like your step by step approach.
“What happened in early June 2017 that triggered a hair cut after 4 weeks”.
Having just analyzed your twitter profile using Power BI I would say that you were about to record a video and wanted to appear presentable. 🙂
Good guess Jess – close.
I didn’t know you could use Selectedvalue() function that way. I thought the Earlier() function would have been the one to use.
Earlier is used to jump between 2 nested row contexts. There is only a single row context in this example, hence EARLIER will throw an error. https://exceleratorbi.com.au/earlier-vs-earliest-dax/
Thanks Matt, there is always something to learn from your posts. I was working on a previous/last week DAX formula and I was getting a week that was not in my Fact (in your word, “simulate” the role of the table above) because I was using weeks from DimDate instead of Fact.
Thanks for this. I like the way you break the problem down into manageable steps. I am going to use this disciplined approach going forward.
Thanks a lot Matt!
What a fantastic way to explain your approach to solve the problems we usually face.