I have delivered Power BI training at a number of universities over the last 6 months, and a few of the participants asked me the same question. “What is the best way to add semesters to a calendar so that they can analyse student data by semester?“ There are various ways of solving this problem. In this article I want to share with you one way to solve it using DAX in Power BI. I will use AdventureWorks database for the demonstration. To keep the demo more realistic, I will rename some of the tables (I wont change the data).
- The Customers table will be called Students
- The Sales table will be called Enrolments by subject
- The Territory table will be called Campus
It is not a perfect one of one swap, but it will serve the purpose I think. I wont change the actual data, but use the data as described above instead. I know student enrolment data is different to this, but I don’t have such data available to me – this proxy should illustrate the point of the article well enough.
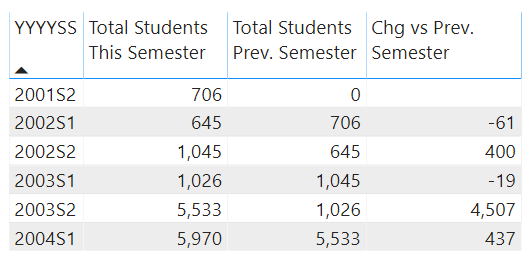
The final report looks something like this.

As is my normal practice, I will show you how to do it step by step below. The technique I will be using is essentially Banding in DAX that I covered in a previous blog post.
The Sample Data
To start with I have created a master data table with semester start and end dates; I called this table SemesterDates. I have assumed that there will be 2 semesters in a year. Of course some universities will have even 3 or 4 semesters in a year – the principle is the same. I have named the two semesters in a year as S1 and S2. I also added a column YYYYSS to create a unique semester and year column. Lastly I added a Semester ID column to facilitate writing the DAX formulas. Note this last column is an integer that uniquely identifies each semester and increments by 1 for every semester that passes.

This is a simple table that anyone can create in Excel. Once created, this becomes the master table that can be simply maintained each year as the new semester dates are released.
Loading the Semester Dates Table into the Power BI Data Model
I loaded the SemesterDates table into the AdventureWorks Power BI workbook. In this case, I am not going to connect the table with any other table in the data model. The purpose of relationships in Power BI is to propagate filters from one table to another – I don’t need to do this, hence no relationships. I also decided to hide the table so that it will not show up in the Report view. This is because I will use it only to write the required DAX formulas (calculated columns) that are required for reporting purpose. This is my Relationship view of the data model.

Adding Calculated Columns in Calendar Table
I always recommend that when in doubt, add measures and not calculated columns. But there are always exceptions to this rule, as I explained in my blog article Calculated Columns vs Measures in DAX. In this case, we are adding the calculated columns to a Lookup table (Calendar) to enhance it and Lookup tables are normally smaller (less rows) and hence the size impacts of Calculated Columns is not so bad. Also, I want to use the result to slice my data, and a measure cannot do that – I need a column.
I added three calculated columns YYYYSS, Semester and SemesterID using the following DAX formulas shown below. I have used the VAR syntax to make the formulas easy to understand. These formulas are essentially the Banding in DAX technique.
YYYYSS = VAR CurrentDate = 'Calendar'[Date]
         VAR Result = CALCULATE(SELECTEDVALUE(SemesterDates[YYYYSS]),
                                CurrentDate >=SemesterDates[From Date],
                                CurrentDate <=SemesterDates[To Date]
                      )
         RETURN IF(Result = BLANK(), "Vacation", Result)
Semester = VAR CurrentDate = 'Calendar'[Date]
           VAR Result = CALCULATE(SELECTEDVALUE(SemesterDates[Semester]),
                                  CurrentDate >=SemesterDates[From Date],
                                  CurrentDate <=SemesterDates[To Date]
                        )
           RETURN IF(Result = BLANK(), "Vacation", Result)
Semester ID = VAR CurrentDate = 'Calendar'[Date]
              VAR Result = CALCULATE(SELECTEDVALUE(SemesterDates[Semester ID]),
                                     CurrentDate >=SemesterDates[From Date],
                                     CurrentDate <=SemesterDates[To Date]
                           )
              RETURN IF(Result = BLANK(), 0, Result)
The trick with the formulas above is to do the following (keeping in mind that it is a calculated column)
- Grab the date for each row in the calendar table (the formula is executed one row at a time – i.e. it has a row context)
- Push a filter onto the semester table so that the semester table shows a single row after the filter is applied.
- The single row must be the row on or after the start date, and also on or before the end date.
- Once the semester table has a single row (after filters have been applied), extract the single value from one of the other columns in the semester table and store it in my new calculated column.
It works because the date ranges in the semester table are mutually exclusive (there are no overlapping date periods where any given date is in 2 semesters).
Defining Measures to Report the Data Insights
Now we are ready to define the required measures to report the data insights. And as the normal practice goes, I have first added a Table Visual to the report with the field ‘Calendar'[YYYYSS] and then keep adding each measure to make sure that my DAX formulas are correct.
The first measure I wrote is to count the number of students. Remember, I am using AdventureWorks here in reality, so it is not a perfect substitute for true enrolments. I am using purchase date from AdventureWorks as a proxy for a transaction date during a semester. The principle is the same, however.
Total Students This Semester = DISTINCTCOUNT(Enrolments[StudentKey])
Total Students Prev. Semester = VAR CurrentSemester = SELECTEDVALUE('Calendar'[Semester ID])
                 VAR PrevSemester = CurrentSemester - 1
                 VAR Result = CALCULATE([Total Students This Semester],
                                         ALL('Calendar'),
                                         'Calendar'[Semester ID] = PrevSemester)
                 RETURN Result
Chg vs Prev. Semester = VAR CurrentSemester = SELECTEDVALUE('Calendar'[Semester ID])
         VAR PrevSemester = CurrentSemester - 1
         VAR Result = IF(PrevSemester <> 0,
                         [Total Students This Semester] - [Total Students Prev. Semester]
                      )
         RETURN Result
A Final Word
As I mentioned at the start, there is more than 1 way to solve this problem, including using Power Query instead of DAX. The downside of using DAX (this method) is you have to write the calculated columns in every new workbook you create. Regardless, it is a simple and useful way to solve the problem.
Really grateful 😊 for the time and effort you put into this
Your work has such a positive impact on everyone who takes time to read 🔥
This website makes it possible to find experts for occasional dangerous missions.
Clients may efficiently set up services for specialized needs.
All listed individuals are experienced in executing intense operations.
hitman-assassin-killer.com
The website offers discreet interactions between clients and workers.
If you require immediate help, this website is the right choice.
Create a job and connect with a skilled worker now!
Hi Matt,
Great article and easy to understand. I’m in the same boat, trying to make dates applicable to a university environment.
I have synced up powerbi with the “termtable” and dates so I applied this code:
Semester = VAR CurrentDate = ‘Calendar'[Date]
VAR Result = CALCULATE(SELECTEDVALUE(YEAR_TYPE_DEFINITION[ACADEMIC_PERIOD]),
CurrentDate >= ‘YEAR_TYPE_DEFINITION'[START_DATE],
CurrentDate <= 'YEAR_TYPE_DEFINITION'[END_DATE]
)
RETURN IF(Result = BLANK(), "Vacation", Result)
But all the returned values are "vacation"
Did I miss anything?
I changed the >= to just > and now I get the start date and end date to appear as the correct semester, but not all the dates in between the start and end dates…getting closer!
Hi Matt,
Thanks for making for this post. I (newbie) am trying to follow your instructions here, but my “Total Students Prev. Semester” , “Total Students This Semester” and “Chg. vs. Prv. Semester” are the same. I am trying to figure out what I am not doing right here. I would appreciate some advise to help point me in the right direction.
Best Regards,
Lyon
Welcome to the long and windy road of DAX. It’s impossible to know what the problem is without looking. DAX and data modelling are deeply joined at the hip. A DAX formula means nothing unless it is clear how the relationships (and hence filtering behaviour works) are configured between tables.
You could do a lot worse than start by reading the articles I have linked in the top menu under “Knowledge base” as a place to start.
Hi Matt,
Thank you for your very useful post. I’m having some trouble when trying to created the Calculated Columns. Here is the error I get: “A single value for column ‘Date’ in table ‘Calendar’ cannot be determined. This can happen when a measure formula refers to a column that contains many values without specifying an aggregation such as min, max, count, or sum to get a single result.” What am I missing?
Thanks in advance for your help!
Regards,
Menac
Hi Menac,
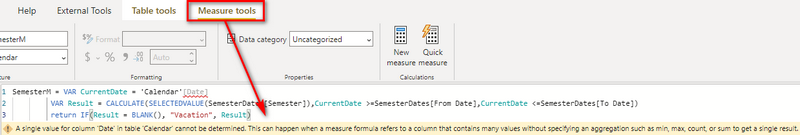
Based on the error you have shared, this suggests you have tried to write the formula as a Measure, not a Calculated Column.
Can you please confirm that the formula is in fact a Calculated Column and not a Measure?
Hi Matt
Great article!
However, I have a more challenging use case. I have a data warehouse environment based on Kimball methodology with multiple fact tables and conformed dimensions, I obviously also have a standard date dimension with one row per day and various attributes, some of which are columns to indicate public holidays and names. This has worked so far to analyze the fact data by holidays (e.g. Compare Christmas this year to Christmas last year).
But now, their is a requirement to introduce different types of “date periods”, not only public holidays. For example School Holidays, Date ranges (e.g. Festive season and Easter season) and now lately COVID Level periods (e.g. Lock Down Level 1). As you can see it is quite possible now that one day (e.g. Good Friday this year) can be associated with a public holiday, school term, Easter season and COVID level group of dates). I am sure there are a number of ways to solve this. The one that I am leaning toward is to have a special “fact” for date periods and then relate it to my date dimension. I hope then that in Power BI, this will have the effect of being able to analyze any of my fact tables by date period.
Your thoughts!
Thanks
Trevor
Yes Trevor, I would definitely create a fact table for these dates. I wrote about something similar here
https://exceleratorbi.com.au/toggle-overlapping-time-periods-using-calendar-table/
Ah, but what if you want a day to day for year over year, or the like, comparisons on enrollment. You can’t use the tried-and-true business measures (Year over year, etc.) since the semester start date is not the same year to year. (It’s been frustrating from this perspective that most in the PBI community demonstrates this with such ease for businesses when it doesn’t work for us in education.) We’ve come up with complicated ways to count the number of days before and since the start date and those act as a marker for comparison (e.g. 2002S1 day -12 vs. 2003S1 day -12) with awkward table manipulations. I’d be curious how you solve this problem. How would you set up the date table? Is there a simpler way we are not seeing?? (Hopefully!)
I would add a calculated column in the table called “Day of Semester” or similar. Start at 1 and progress to the last day of the semester. Then you have a reference for comparison
Matt,
We have never met but I read your articles each week. I write because of your article about higher education. I help build data warehouses for higher education. My latest is using Power Query/Power BI.* That is why I find your example of equating enrollment with sales interesting. Not to sound preachy, I would use the term registration instead of enrollment, since higher ed administrators, at least in the states, tend to confuse counting students enrolled at the institution and counting students enrolled in a class. (Likewise they can confuse the terms class and course, and so on.)
I prefer to put measures in the tables most related to them. Therefore, I have many measures attached to the registration table. The grain of the registration tale is one record per student per class per term. Two notes here. Class is sometimes referred to as sections of a course but that can be ambiguous across institutions or even within divisions in the same institution. More importantly is the use of term instead of date. With some exceptions (daily enrollment reporting), analysis in higher ed is done at the term level. That is why when building data warehouses for higher ed I have a term table separate from the calendar table. I don’t think this is a requirement, though we do make many decisions on how best to put a particular student attribute or measure into a particular term. After reading your article, I will need to think about this.
The other fact table I use I call the student term table. The core of this table is created by aggregating the registration table up to one record per student per term. I then append other information that can be asynchronous to it. National Student Clearinghouse data, Admissions, External Credits, Development Test Scores, Advisement etc. This is done by first aggregating these data up to the student term level.
I now have a table containing all the student term records but there can be duplicates. By eliminating the duplicates I have a table that contains one record per term that can be used to analyze student progress. To pick on development testing, how many students who test into developmental course actually enroll at the institution? How many take the course? How many pass the course? How many graduate? How long does it take them? Are there other student characteristics (e.g. Financial need), besides development test scores that are correlated to these statistics?
Thanks again sharing all your insights with us.
Michael
*Before that I worked with a small company, iStrategy, now Blackboard Analytics, to integrate Institutional Research data into their SSAS data warehouse. Before that I used SAS to build what, at the time, was referred to as the “Megafiles”.
Very interesting comments, Michael. I work for a community college and worked for a university for almost 10 years prior to that. I have been developing home-grown solutions during that time (well, the university I worked for tried to license iStrategy for their system but delayed for many years and ultimately did purchase Blackboard Analytics not long before I left). I am now trying to build a data warehouse solution sourced from a Colleague student information system (SIS). I created a data table that includes term information sourced from the SIS and build a huge number of relevant fields for higher education.
Your comments about confusing terms are so spot on! I am trying to learn what I can about designing the proper data warehouse so I can feed my Power BI Report Server reports for campus consumption. Thank, Matt, for the great example – even if it is imperfect I think the concept comes across loud and clear!
Hi Michael
For the record, I was not trying to equate sales with student enrolments. It is just that often the effort to create realistic data is higher than the effort to explain the concept. I don’t have any student registration data and hence I decided to use to use the Adventure Works DB as a proxy. I realise student registration information is different however I didn’t think it would have any impact on the key point of the blog. I have added a couple of extra sentences to make that clearer in the article.
Hi Matt, thanks for sharing the formulas, it is a very clean and simple approach with disconnected table. And some will find it much simpler than Power Query way, where to extend Calendar table in the same way you would need a custom function for checking “disconnected table” for YYYYSS / Semester / Semester ID values.
Regards,
Ivan