Tabular Editor is a community Open Source software project written by Daniel Otykier. I have known about this product for several years but never really invested the time to understand what it does and how it can help me do my job. Last week I attended the Microsoft Virtual MVP Summit live from Redmond, USA. During the conference, Daniel gave a presentation on how Tabular Editor works, and I have to say I was amazed. Many professional tabular modellers will already know about this tool, but I think many of my reading audience will not. This article is of course for everyone, but particularity my readers who may not know about this product.
What can I do with Tabular Editor
In short, lots of things. I will cover more features in the future. For this article I am going to show you how to automate the creation of measures so quickly that it will make your eyes water – believe me. Just don’t tell the boss how quickly you can do it or you might end up with more work.
Limitations of Tabular Editor with Power BI
Currently Tabular Editor can only operate over Power BI Template files (more on that later). It has the ability to write back changes made by Tabular Editor back to the template file, however be aware that this is not currently supported by Microsoft (back up first). Despite it not being supported, Microsoft has announced that it will be supporting such features in the future. In fact with the March 2020 release, Microsoft introduced a preview feature “Store datasets using enhanced metadata format”. This new data format is part of the journey to re-plumb the back end to support XMLA read/write for management of Power BI datasets.
I can’t wait to see what the future holds in this space. OK, so let’s get started already!
Download and Install Tabular Editor
Firstly download the latest version of the Tabular Editor from Github here https://tabulareditor.github.io/
Install the tool on your PC – you may have to override any security warnings by Windows defender about the publisher being “unknown”. Daniel is a good guy, so you can proceed with the installation with safety. You can then create a shortcut to the TabularEditor.exe file and pin it to Start for easy access. Make sure you leave the option to add a shortcut checked during installation.
After installation, run Tabular Editor and take a look. It looks like this.

Enable the New Metadata in Power BI Desktop
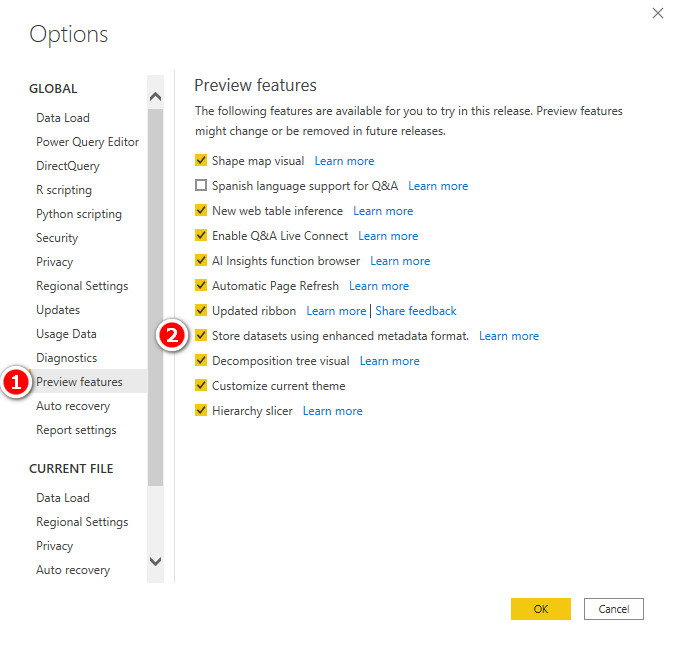
You will need the March 2020 or later release of Power BI Desktop. You can check the version of your Power BI Desktop from the menu – Help -> About. Once you have the March 2020 or later version of Power BI Desktop, you need to enable the preview feature. Go to File -> Options and settings -> Options. Then click on Preview Features (#1 below) and check the box to enable the feature (#2 below).
Close and restart Power BI Desktop to make the feature active. Strictly speaking you don’t need to do this to use Tabular Editor in the unsupported way using the template file. But then again, why wouldn’t you use it given this is the future.
Creating a Power BI Workbook Template File
In order to utilise the functionality of Tabular Editor with Power BI Desktop, you need to save your Power BI workbook as a Power BI Workbook Template file. For illustration, I have taken a Power BI Desktop workbook (.pbix) with a basic version of Adventure Works data model loaded, and saved it as a Template (.pbit) file (#1 below).

This is the file (.pbit) that you can use in the Tabular Editor as of now. The template file contains all the structure of the PBIX file, but it doesn’t contain any of the data.
Opening the PBIT File in Tabular Editor
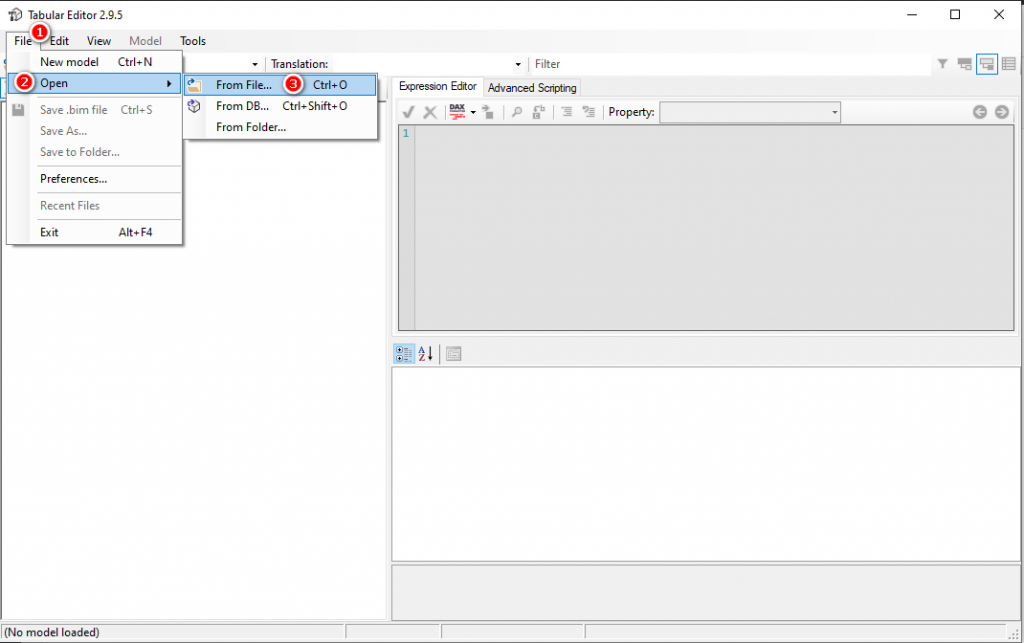
In Tabular Editor, click on File (#1 below), then on Open (#2 below) and then on From File (#3 below).
Navigate to the saved .pbit file and open it. You might get a warning message as Power BI does not yet support all the Tabular Editor features. Click on OK and proceed.
Starting with Tabular Editor
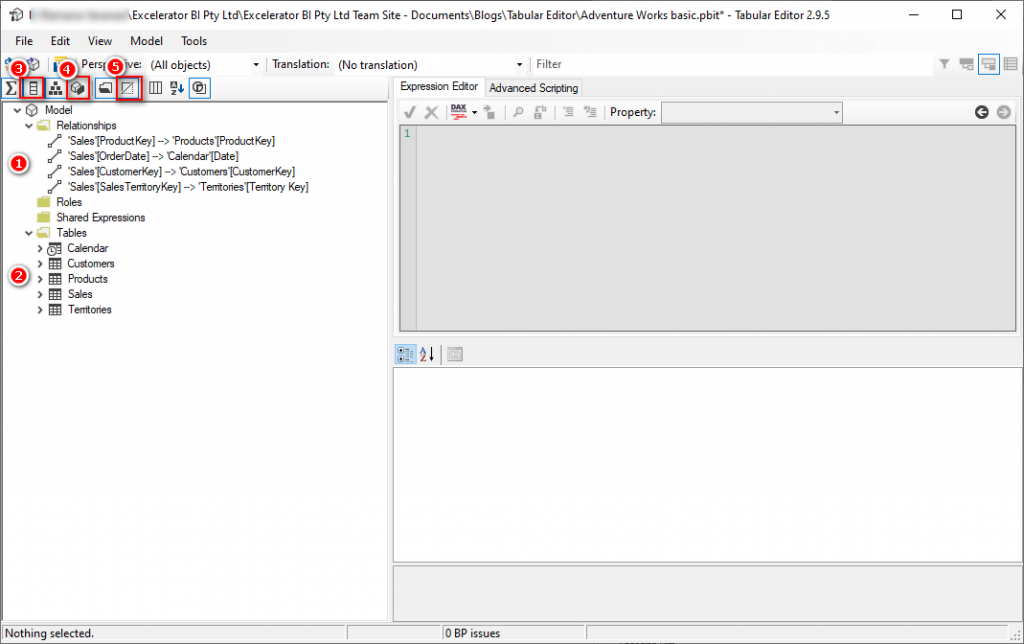
You can see your model components in the left hand panel. Take note specifically about the Relationships (#1 below) and Tables (#2). As we are going to work with a Power BI data model, I recommend you do the following:
- Show Columns (#3)
- Hide Partitions (#4)
- Show Hidden Objects (#5)
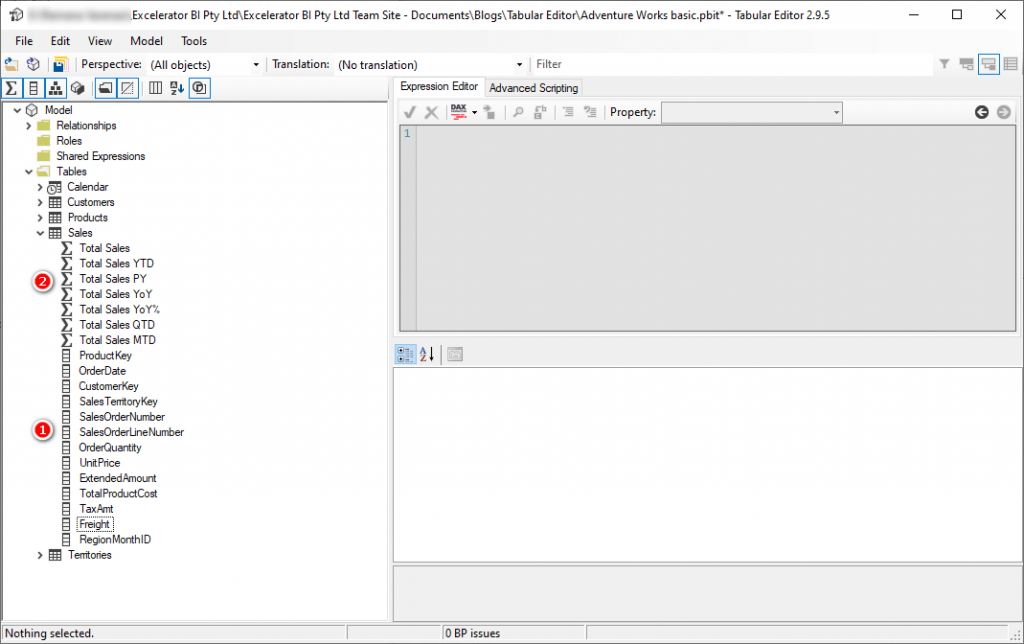
Now if you expand the tables as shown below, you will see the columns (#1 below) and the existing measures (#2 below).
Quickly Creating Measures Using Advanced Scripting
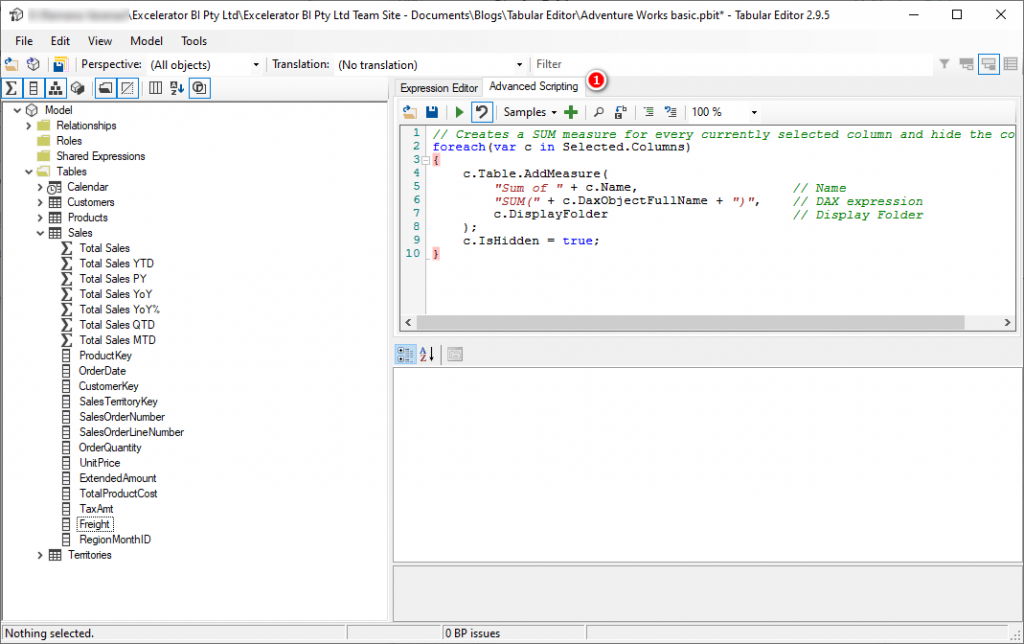
Next, I will show you how you can create multiple measures using the Advanced Scripting feature in Tabular Editor. You can create your own script file or download an existing script file from a script library such as Github, and then rapidly create a number of similar measures in no time at all.
Downloading a Script File
Here is a great link to some useful scripts https://github.com/otykier/TabularEditor/wiki/Useful-script-snippets.
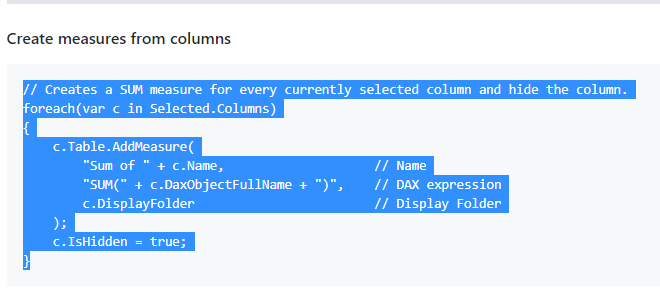
Scroll down to the section Create measures from columns. Copy the code given in that section.
Running the Script to Create Multiple Measures at the Same Time
Now you are ready to run the script on multiple columns at the same time. The script generates measures on every selected column to create totals.
- Select the columns in the left panel with Ctrl key pressed down (#1 below)
- Click on Run Script (#2 below).

In my example, 4 measures (#1 below) were created for each of the selected 4 columns. Note that the columns used in the measures are now hidden (#2 below) – this was also part of the script. Click on a measure and then on Expression Editor tab (#3 below). The DAX formula that was generated for the measure is displayed (#4 below).

So there you go, 4 measures created in a few seconds. How cool is that!
Creating Time Intelligence Measures
Now for something even better. Writing Time Intelligence functions in DAX can be very time consuming, expecially when you have to create sets of time intelligence measures across many base measures, like [Total Sales], [Total Quantity], [Total Cost], etc. You can easily create a full set of Time Intelligence measures across multiple base measures using an advanced script. Here is a sample script that does just this (you can download this from the link provided above).
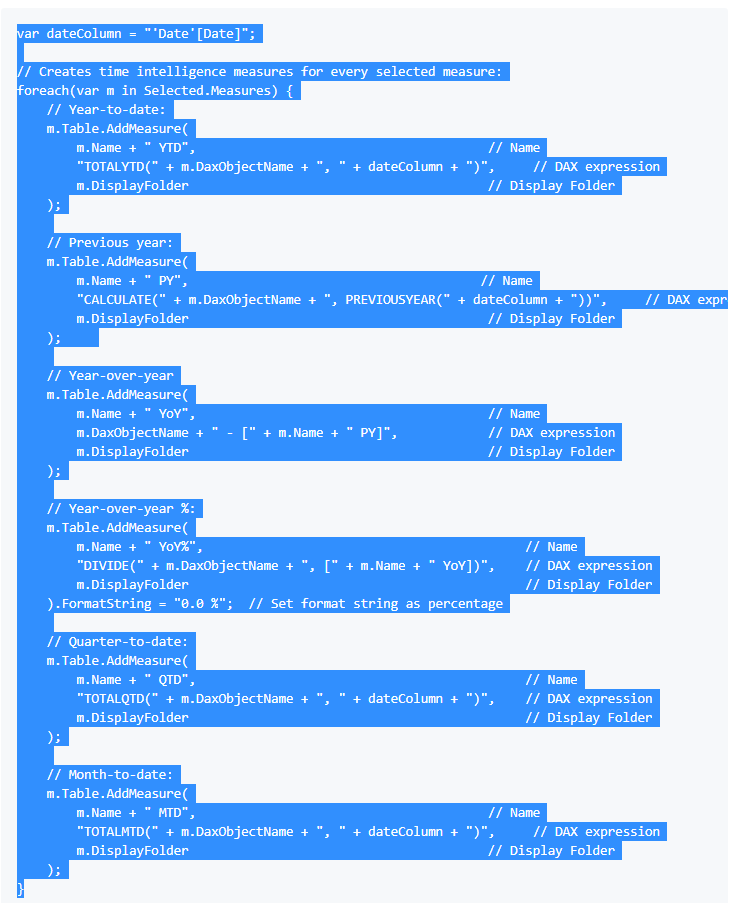
I copy-pasted the code into Tabular Editor. Before moving on, I changed the reference to the calendar table (it is Date in the script, but mine is called Calendar). When you use these scripts in your data models, you may need to edit them before use. I then saved the script giving the name as Create Time Intelligence Measures.
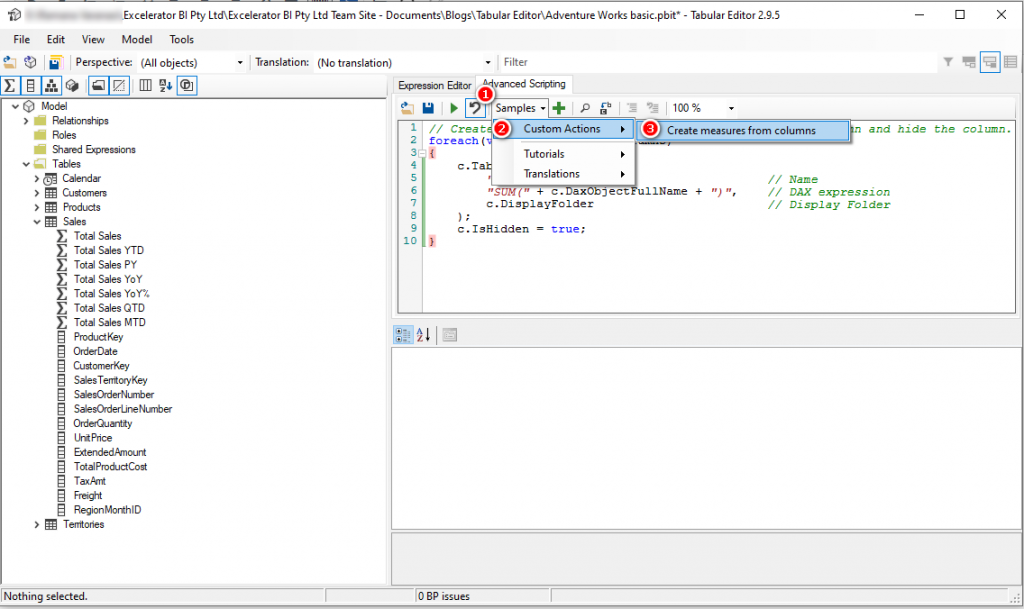
In the left panel I deleted all the measures apart from the Total Sales measure. Next, I right-clicked on Total Sales (#1 below) and then on Custom actions (#2 below) and then on the script I saved before (#3 below).

Tabular Editor jumped into action and automatically created the set of Time Intelligence Measures (#1 below) based on the measure Total Sales.

Lastly, save the file and exit Tabular Editor.
Using the Measures Created in Tabular Editor in Power BI
Warning: As you are going to use a preview feature that is not yet supported, always keep a back up your Power BI workbook before proceeding.
- Start Power BI Desktop.
- Open the .pbit file that you used in Tabular Editor.
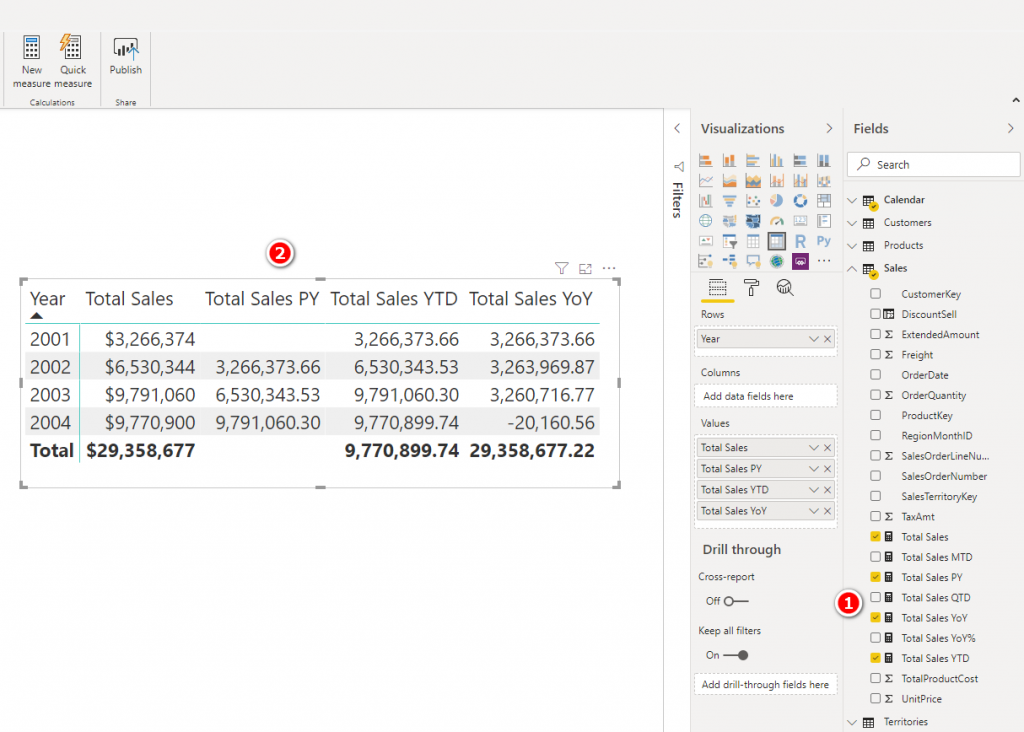
Note that Power BI Desktop connects and then refreshes all the tables from the data source – this is the standard behaviour when opening a template file. You can then see the measures (#1 below) and their values (#2 below).
12 Measures in 10 Seconds
I wanted to produce an animated gif image for this post showing how easy it was. Here it is. 12 time intelligence measures in 10 seconds.
What Else?
There are lots of other things you can do with Tabular Editor, including migrating measures between workbooks among other things. I would love to hear from people about what their favourite feature is and I may write a future post showing how to do that.
What the?
I started to prepare for next week’s blog article – how to copy measures between PBIX files using Tabular Editor. I knew I had done it before but couldn’t remember how to do it. So I went to Google. Look what I found?! https://exceleratorbi.com.au/copy-measures-between-2-power-bi-files/ It seems I already wrote this article a year ago! I think given the interest in this article, I will re-release the copy measures post again next week.
I like the efforts you have put in this, regards for all the great content.
This blog is such a hidden gem I stumbled upon it by chance and now I’m completely hooked!
I have been following your blog for a while now and have to say I am always impressed by the quality and depth of your content Keep it up!
I do not even know how I ended up here, but I thought this post was great. I don’t know who you are but definitely you’re going to a famous blogger if you are not already 😉 Cheers!
I’m so incredibly grateful for the wisdom and experience you generously share through your writing. It’s truly impactful and provides valuable guidance for my own personal and professional development. Thank you for being such a rich resource.
Holiday items were brand new
Affordable stock every order
Reliable option for resale
Trustworthy company to buy from
Truckload process is smooth
Always recommend this supplier
Seasonal stock sold well
Excellent option for resellers
Informative and concise. I recommend https://pdfpanel.com to my peers.
Good for side business
Great mix of items inside
Reselling made simple
Best pallets in California
Walmart pallets profitable
Truckload process is smooth
naturally like your web site however you need to take a look at the spelling on several of your posts. A number of them are rife with spelling problems and I find it very bothersome to tell the truth on the other hand I will surely come again again.
You made several fine points there. I did a search on the matter and found mainly folks will have the same opinion with your blog.
Hey There. I found your weblog the usage of msn. This is a really neatly written article. I will be sure to bookmark it and return to learn more of your useful info. Thanks for the post. I’ll certainly comeback.
I believe you would find a massage very beneficial. It’s a wonderful practice.
This is a valuable investment in your health. Don’t overlook the power of massage.
I believe you would find a massage very beneficial. It’s a wonderful practice.
A little self-care goes a long way. Let a massage melt all your stress away.
You deserve this quiet moment just for you. Escape the world with a blissful massage.
Great tips! I’ve been using https://pdfpanel.com alongside these methods with good results.
Brilliant cool funny strange strange bad helpful bad.
Мобильная версия работает через зеркало казино
bone strength energy boost seafood blood pressure vegetables metabolism boost gym alternatives competitor keywords longtime results meal prep workout motivation fruits lean meats outreach keywords healthy lifestyle health keywords iron deficiency blog wellness lifestyle wellness healthy habits cardio exercise blog health interval walking fitness topics lifestyle change antioxidant foods seafood whole foods hydration weight control healthy recipes backlink keywords sleep quality cardiovascular health daily steps count lean meats topics guest post beginner walking workouts low impact exercise diet tips metabolism boost bodyweight workouts fitness article fitness tracker wellness blog daily steps count vestibular health healthy lifestyle physical fitness fitness topics backlink keywords probiotics nutrition articles stability advice walking routine backlink keywords cardiovascular health interval walking healthy diet guide weight loss fruits mood improvement lean meats lean meats healthy habits tips healthy eating fruits fruits resistance training fruits walking health benefits walking health benefits physical fitness fitness keywords gut health cardiovascular health physical fitness fitness tracker strength training content long tail digestion support competitor keywords portion control eggs plan your meals fitness topics health keywords iron supplements muscle strength dizziness solutions plan your meals gear hydration sleep quality mental well‑being clean eating olive oil content long tail weight loss pedometer tips mood improvement
أصبح فوائد العنب على الريق من المواضيع الشائعة في مجال الصحة والتغذية. تشير دراسات حديثة إلى أن فوائد العنب على الريق يحتوي على مركبات فعالة تعزز مناعة الجسم. لا تزال فوائد فوائد العنب على الريق تتوارثها الأجيال في المجتمعات الشرقية. لكن من الضروري استخدام فوائد العنب على الريق بشكل معتدل وتحت إشراف مختص. وهكذا، نجد أن فوائد العنب على الريق يحمل الكثير من الإمكانات العلاجية التي تستحق الاستكشاف.
تُعد خدمة تنظيف خزانات بلجرشي اقتصادية من أبرز الخدمات التي يحتاجها السكان في السعودية، خصوصًا مع أهمية تنظيف خزانات بأسعار مناسبة في الحفاظ على الصحة العامة، ولهذا فإن تنظيف خزانات مضمون تُعد خيارًا مثاليًا للحصول على جودة عالية وخدمة مميزة. تقديم خدمة احترافية وسريعة هو ما يميز الشركات الرائدة..
في عالم الضيافة العربية، لا شيء يضاهي روعة تمور المدينة المنورة، لومي حساوي فاخر، تمر رزيز فاخر، عصيدة حساوية جاهزة، تمور الذهب الأحمر، تمور بدون مواد حافظة، تمر معبأ بإتقان، الحسا، متجر تمور أونلاين موثوق، كرتون تمر شيشي جامبو، تمر النخبة الفاخر، هدايا تمور فاخرة للعائلات. تُعد هذه المنتجات رمزاً للجودة والفخامة، حيث يتم اختيار أجود أنواع التمور والمنتجات الحساوية بعناية فائقة. من المعروف أن التمور ليست مجرد طعام، بل هي إرث ثقافي يعكس كرم الضيافة العربية وأصالة المذاق الفريد. كما أن الطلب المتزايد على هذه المنتجات جعلها خياراً مثالياً للمناسبات الخاصة والاحتفالات، لتكون دائماً حاضرة على الموائد. إن تمر النخبة الفاخر يعكس تميز الإنتاج المحلي وجودته.
Nicely done, legends.
Flat out fantastic! Thanks for taking the time to share.
I?¦m no longer positive where you’re getting your information, however good topic. I must spend a while learning more or working out more. Thanks for wonderful information I was looking for this information for my mission.
GTA VI Beta: Play the Game https://gta2026.pythonanywhere.com
GTA VI Beta: Your Voice Counts https://gta2026.netlify.app
First Look GTA VI Beta: Stunning Visuals Await! https://rockstargames.pythonanywhere.com
This was beautiful Admin. Thank you for your reflections.
I do not even understand how I ended up here, but I assumed this publish used to be great
I have not checked in here for a while as I thought it was getting boring, but the last several posts are great quality so I guess I?¦ll add you back to my everyday bloglist. You deserve it my friend 🙂
There is apparently a bunch to realize about this. I consider you made various nice points in features also.
reparación de maquinaria agrícola
Aparatos de calibración: clave para el rendimiento fluido y óptimo de las dispositivos.
En el campo de la tecnología contemporánea, donde la rendimiento y la confiabilidad del aparato son de máxima significancia, los aparatos de equilibrado cumplen un tarea vital. Estos sistemas adaptados están diseñados para ajustar y fijar componentes móviles, ya sea en maquinaria productiva, transportes de transporte o incluso en electrodomésticos domésticos.
Para los técnicos en soporte de dispositivos y los técnicos, trabajar con dispositivos de equilibrado es importante para asegurar el rendimiento estable y seguro de cualquier mecanismo móvil. Gracias a estas alternativas avanzadas modernas, es posible disminuir significativamente las vibraciones, el ruido y la carga sobre los cojinetes, extendiendo la vida útil de piezas valiosos.
También importante es el rol que cumplen los equipos de ajuste en la asistencia al comprador. El soporte especializado y el mantenimiento regular aplicando estos aparatos facilitan ofrecer servicios de gran nivel, elevando la agrado de los consumidores.
Para los responsables de emprendimientos, la financiamiento en sistemas de calibración y dispositivos puede ser esencial para aumentar la rendimiento y productividad de sus dispositivos. Esto es especialmente importante para los empresarios que gestionan modestas y modestas organizaciones, donde cada elemento cuenta.
Asimismo, los sistemas de balanceo tienen una gran utilización en el campo de la prevención y el gestión de estándar. Permiten detectar probables fallos, impidiendo reparaciones caras y averías a los dispositivos. También, los datos recopilados de estos dispositivos pueden emplearse para perfeccionar procedimientos y aumentar la exposición en sistemas de consulta.
Las áreas de uso de los sistemas de calibración comprenden diversas áreas, desde la fabricación de ciclos hasta el supervisión del medio ambiente. No interesa si se considera de importantes producciones industriales o modestos locales hogareños, los aparatos de ajuste son fundamentales para asegurar un desempeño efectivo y sin presencia de fallos.
istanbul çatı ustası
Get tips from this aviator game review
Good post! We will be linking to this particularly great post on our site. Keep up the great writing
I consider something genuinely interesting about your weblog so I bookmarked.
Mikrokredit zaim — apply now
Зарегистрируйся на 1WIN и начни играть в Лаки Джет — легкий старт.
I really like looking through and I believe this website got some genuinely utilitarian stuff on it! .
Do you have a spam problem on this blog; I also am a blogger, and I was wanting to know your situation; many of us have created some nice methods and we are looking to swap solutions with other folks, be sure to shoot me an e-mail if interested.
You are my inhalation, I own few blogs and often run out from to post : (.
I beloved up to you’ll obtain performed proper here. The cartoon is tasteful, your authored subject matter stylish. nonetheless, you command get got an nervousness over that you wish be delivering the following. sick indubitably come more earlier again since exactly the same just about a lot steadily inside case you shield this hike.
You are a very clever individual!
I’ll immediately grab your rss feed as I can not find your email subscription link or newsletter service. Do you’ve any? Kindly let me know in order that I could subscribe. Thanks.
Hey very cool site!! Man .. Beautiful .. Amazing .. I will bookmark your site and take the feeds also…I’m happy to find numerous useful info here in the post, we need develop more strategies in this regard, thanks for sharing. . . . . .
naturally like your web site however you need to take a look at the spelling on several of your posts. A number of them are rife with spelling problems and I find it very bothersome to tell the truth on the other hand I will surely come again again.
Very well presented. Every quote was awesome and thanks for sharing the content. Keep sharing and keep motivating others.
Hey Matt,
Have you or someone else created a script for tabular editor that would create a date table?
Thanks love your articles
No I haven’t, and I don’t think this is the best tool. I believe this should be done in Power Query. I do have an article on that https://exceleratorbi.com.au/build-reusable-calendar-table-power-query/
At the bottom of the article, I show you how to copy the code for reuse. It takes me 30 seconds to create a new calendar table.
That’s awesome time saver. Can we do this based on the name of the measure? i.e., if the measure name contains a string then only show it in description else do not.
The same goes for columns, hide a column if it has a keyword in it.
For example1: If column name is “abc” then hide, else do not hide and put it in s display folder.
For example2: If column name is “Month” OR Year and its corresponding datatype is Integer
then Do Not Summarize and put in display folder, else do not hide and put it in s display folder.
Appreciate your quick help in this regard.
My guess is you could modify another script I shared to do what you want.
https://exceleratorbi.com.au/edit-replace-code-inside-all-dax-measures-using-tabular-editor/
Thanks for sharing, a great time saver over time with the time measures example. //Daniel
Hello Matt
I tested all the interactions you show between tabular editorial and a power BI report
All this is possible, I think by activating the new metadata (allowing xmla read / wite access)
I also tested the possibility of translation (it works)
–> https://thebipower.fr/index.php/2020/04/12/automatic-translation-of-tabular-model/
However, a problem appeared while creating a calculationgoup
I think it is not yet implemented in powerbi desktop? (…not valid M expression)
–> https://forum.enterprisedna.co/t/calculation-groups/6224
(Or should you connect to the PREMIUM work space dataset?)
Bravo for all your posts
correct. Calculation groups are still not supported in Power BI Desktop. They ARE supported in Power BI Premium, so you can pretty well take that as a sign that it is coming to Power BI Desktop soon. There is no point having that ability in Premium if you can’t build it in Desktop. My guess is this is a standard deployment step. Both the service and Desktop need the feature, it is just a matter of timing when they get deployed. Now given today is 27th April and we still haven’t seen the April version of desktop yet, my guess is MS has had a few bug issues this month. There is plenty more goodness ahead, I’m sure 🙂
Hi Matt,
Great content and sharing once again. Sorry to come back to this one so late after the last posts but I get the “not a valid M expression” error when editing the PBIT file using Tabular editor. I could not follow the steps in this article without the error.
Any help would be greatly appreciated…
Thanks
Matt
Hi Matt. I’m not sure what is going on here. Tabular Editor doesn’t do anything in Power Query, and this is a Power Query error. Maybe take a look at my later article where it shows how to connect to a running PBIX and not the PBIT. Make sure you take a backup copy of your file first – some things are not supported and things can break. Otherwise, you have my email already. If you want to send me a video showing what is happening, I will give you my view. Alternatively, look at my next post
God bless you man,
please keep posting about Tabular Editor.
Kind of tutorial?
Stay safe these days
Will there be a “cloud” based version of Tabular Editor? One of the limitations of Power BI Service is that you can’t do DAX in the cloud, so my customers who have Apple products use Tableau instead. If there were a cloud solution to build DAX calculations for Power BI Service, this might solve that issue.
I doubt there will be a cloud based version of TE. JMO
Hi
One thing that will break the model is if you create new tables in your model.
Other than that it works like a charm.
One thing you should include is how easy it is to create folders. And how that works for your scripts as well.
Great article.
Matt,
Thank-you for this!
Your content is always outstanding and this tool looks exceptional. This difficult moment in our history presents a perfect time to introduce more complex topics as we (I am in Italy under lockdown for over three weeks now) bizarrely have more time to work through them.
It would be great to see Microsoft offer more learning opportunities at reduced prices during this time. Or perhaps they could offer a developer/student edition of premium capacity for a limited period? (The Power BI team have published a great series on Paginated Reports this week – but without the software license, it is tough to work through it.)
You have taken a strong lead, once again thank-you for everything you publish.
Hi Graham.
I have a few free lessons online if you are interested (some Power Query lessons and also some free intro to DAX and Power BI). Just look in my shop https://exceleratorbi.com.au/my-courses/?my_courses_status=all
Also, have you looked at my blog about low cost premium? Maybe this could work for you paginated reporting needs https://exceleratorbi.com.au/affordable-power-bi-premium-for-small-business-part-1/
Hi Matt –
Thanks for making Tabular Editor more accessible!
I’m interested in creating a handful of CALCULATE() measures based on modifying the filter context of a single column, but iterating through the values of a list. Something like this:
[Sales (Install)] = CALCULATE([Sales], fact_Data[InvoiceType] = “Install”)
[Sales (Service)] = CALCULATE([Sales], fact_Data[InvoiceType] = “Service”)
[Sales (Contract)] = CALCULATE([Sales], fact_Data[InvoiceType] = “Contract”)
Can a script be written where I pass in the list {Install, Service, Contract} and iterate over that?
Follow-up….can I dynamically create that list based on evaluating a DAX expression…like VALUES(fact_Data[InvoiceType])?
Yes you can do this, but be careful with the references.
I have found that the thing you are looking for, is not really worth the initial work, since it will be different from model to model.
The scripts of time intelligence are great because the will be the same across many models.
Hi Kristoffer –
Would you mind sharing a link to the method?
I understand it will be different from model to model, but it should be minor tweaks to a pattern.
I have 112 values I need to iterate over, which is likely to triple.
Best,
~ Chris
I’m no expert, and I will learn over time. But for now, maybe this could help you out?
https://github.com/otykier/TabularEditor/wiki/Useful-script-snippets#generating-measures-from-a-file
This is fabulous, thanks for researching!
Can likely use M or DAX to generate the table in TSV file to feed into Tabular Editor.
That’s what I was thinking too. Or just export from a Power BI table visual
Hi Chris. This is now fully supported in TE. Read about it here https://darren.gosbell.com/2020/08/the-best-way-to-generate-data-driven-measures-in-power-bi-using-tabular-editor/
Hi Matt,
Thanks for the write up on Tabular Editor. How does this stack up against DAX Studio? It would be nice if there is some comparison of both tools.
Thanks again for the wonderful article.
Regards,
Eddie
Thanks Eddie. The short answer is that DAX Studio is a query tool For tabular models – read only. Tabular Editor (as its name suggests) is an editing tool for tabular models. It has write back capability.
Thanks for this – looks very useful. I have tinkered Tabular Editing by connecting to an open PBIX file – it’s been useful for exploring and documenting a data model, but I’ve never been able to write-back to it. The PBIT method isn’t working for me though – for everything I try it on I get the same error message:
“Error: Unrecognized JSON property: sourceQueryCulture. Check path ‘model.sourceQueryCulture.”
Any ideas what that means and how I get around it?
Only a guess, but the error says “culture”. Do you by chance use ; instead of , for separators? I think I remember Daniel saying that under the hood, a PBIX file stores everything as a ,
Great information, thanks Matt. Tabular Editor looks like a great time-saver. Will definitely check it out. Cheers
Thanks Matt
I wasn’t aware of TE & your demo was very clear as usual.
Would love to see more.
Stay well
Thank you very much for sharing. I have heard the Tabular editor but I’ve never worked with it. It is amazing what you are showing and what this software can do. I am looking forward for your next articles concerning Tabular editor!
Thank you once again!