Excelerator Blog - Articles on Power BI, DAX, Data Modelling & more
Matts World Tour

Matt’s Power BI World Tour

I have been planning for various speaking and training events over the last 6 months and these events are now rapidly approaching.  As it turns out, it seems I have a bit of a world tour planned and so I wanted to share these plans with you in the hope […]

Read More »

List of all standard Power BI Icons

Power BI Icon Names

A few weeks ago I wrote an article “Conditional Formatting Using Icons In Power BI” about the Power BI Icon feature released in July 2019. There were 2 common questions/themes coming from readers’ comments, and I want to address those here. Where can I find a list of Power BI […]

Read More »

Large Customer Sales

The FILTER Function in DAX Part 2

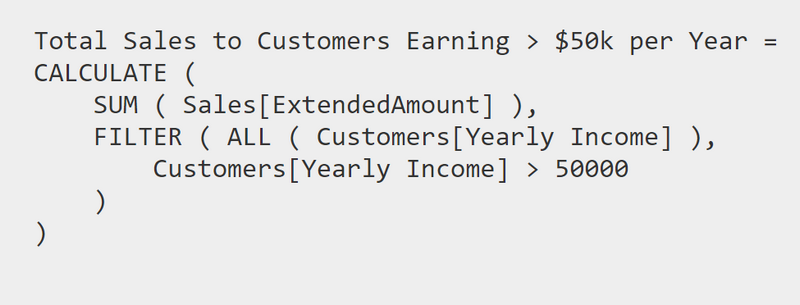
Level: Intermediate In my last article, I introduced the basics of the DAX FILTER() function. Hopefully that introductory explanation to FILTER() helped you get your head around what FILTER() is doing under the hood. With that knowledge in place, let me help you take your understanding to the next level. […]

Read More »

Final Chart 2

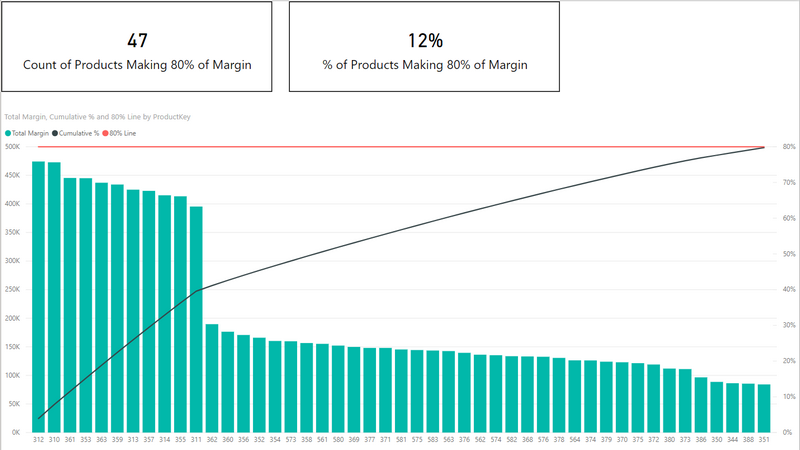
Pareto Analysis in Power BI

Level: Intermediate Pareto Analysis is a statistical technique that applies the Pareto Principle to data. This is more commonly known as the 80:20 Rule. The Pareto Principle is based on the presumption that a relatively small number of inputs (20%)  have most impact on the results/output (80%).  The 80:20 rule […]

Read More »

Scroll to Top