Skip to content
Agile Insights Excelerator Bi Logo Black 350 X 77 July 2024
  • Consulting
    • Expert Power BI Consulting
    • Remote Help & Support
  • Training
    • Public Training
    • Corporate Private Training
  • Blog
  • Shop
    • Live Training
      • Power BI Training
      • Corporate Private Training
    • Consulting
      • Remote Help and Support
    • Books
      • eBooks and Paper Backs
  • Knowledge Base
    • Getting Started
      • 30 Reasons You Should Be Considering Power BI
      • What is Power BI
      • What is Power Pivot
      • What is Power Query
      • What is DAX
      • The Best Way to Install Power BI Desktop
      • Power BI is an Enigma, so What to Do?
      • Who Needs Power Pivot, Power Query and Power BI Anyway?
      • Top 10 Tips for Starting Power BI
      • Best Practices
      • Versions
      • Downloads
      • Installing
      • How and Where to Get Help for Power BI
    • Key Concepts
      • Data Shape
      • Shaping vs Modelling in Power BI
      • Thinking of Data in Tables
      • When to Create a Lookup Table
      • Relationships in Power BI and Power Pivot
      • Multiple Relationships
      • Calendar Tables
      • Multiple Data Tables
      • Time Intelligence
      • Columns vs Measures
      • Visually Appealing Power BI Reports
      • Power BI Sharing
      • DAX as a Query Language
    • Other Resources
      • Power Reading
      • Power Pivot Forum
      • Links to useful stuff
  • Videos
  • Search

Search Articles

Blog Categories

Archives

Please select a valid form.

Power BI Online Training

Power BI Online Training

Demystifying DAX (Advanced DAX) Online Training

Advanced DAX Online Training

Power Query Online Training

Power Query Online Training


Live Training Brisbane

Power BI for the Business Analyst – Brisbane 2019

Cart

Product Categories

  • Live Instructor Led Training
    • LivePBI4BAOnline
  • Consulting
    • Coaching and Help
  • Miscellaneous

Filter One Slicer Based on Another Slicer in Power BI

By Matt Allington / July 13, 2021 March 11, 2022 / DAX, How to, Intermediate, Learning Resource, Power BI, Power BI Desktop

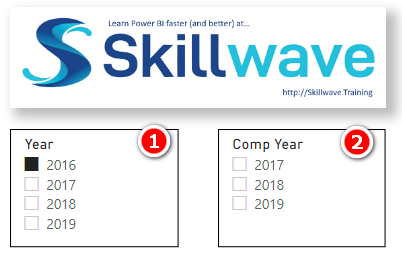
This is a follow up article from my last blog post where I demonstrated how easy it is to use two slicers to compare any two items. In the demo in my article, I specifically showed how you could compare any 2 years of choice, but the principle applies to […]

Read More »

Compare Any 2 Of Anything

Compare Any Two of Anything in Power BI

By Matt Allington / June 28, 2021 June 29, 2021 / Beginners, CALCULATE, DAX, How to, Learning Resource, Power BI, Power BI Desktop

I have been increasingly recording videos as my method of sharing tips and techniques for getting more out of Power BI. Some concepts are best documented (traditional blogging) and some are just easier for everyone if it is a video. That is the case again for today. Compare Any Two […]

Read More »

Fill To The Right Featuredimage

Fill Data to the Right in a Table

By Matt Allington / June 23, 2021 July 7, 2021 / Beginners, DAX, How to, Power BI Desktop, Power Query

I was helping someone recently with an issue. They wanted to allow end users (department managers in this case) to enter data in a table as simply as possible, and then use this data for reporting. The challenge often is, that the easiest way to enter data from a user’s […]

Read More »

Tabular Editor 3

5 Productivity Benefits of Tabular Editor 3

By Matt Allington / June 7, 2021 June 8, 2021 / Beginners, DAX, Power BI Desktop, Tabular Editor

Tabular Editor is a Power BI Tabular Modelling productivity tool developed by Daniel Otykier. I blogged about Version 2 of the Tabular Editor in this article here. The 3rd edition of Tabular Editor has just been released, and it is a major upgrade from version 2. TE 3 is not […]

Read More »

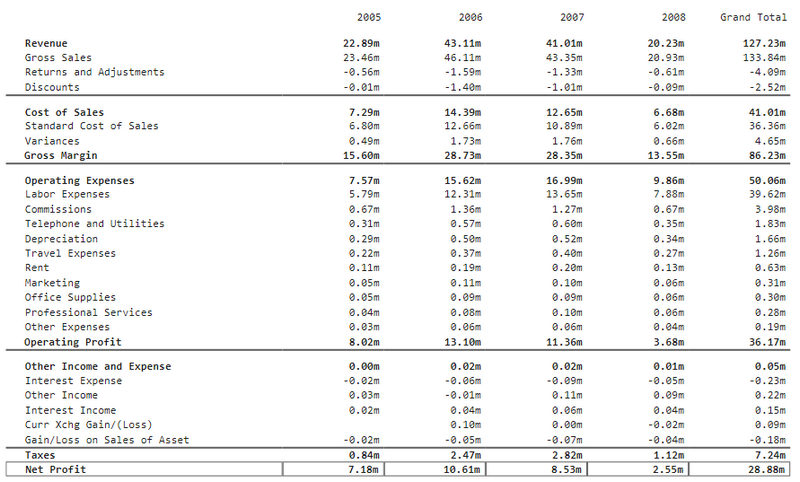
Build a P&L in Power BI Without Any DAX

By Matt Allington / May 28, 2021 February 16, 2022 / Custom Visuals, How to, InfoRiver, Power BI

This is the third article where I have covered building a P&L in Power BI. My first 2 articles here and here focused on how to use the DAX language to solve some of the common problems with P&L reporting, such as adding sub totals into the visual, % of […]

Read More »

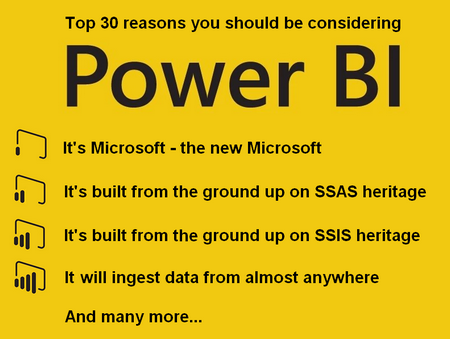
Top 30 Reasons Why You Should Consider Power BI

By Matt Allington / May 19, 2021 August 11, 2022 / Power BI

I first wrote this article back in Feb 2017 to be a definitive list of the top reasons why you should learn how to use Power BI in your organization (in case you haven’t already made the decision to do so).  In fact there is only one thing that worries […]

Read More »

Calendar Over Run in Power BI

By Matt Allington / May 4, 2021 May 4, 2021 / DAX, Intermediate, Power BI, Reports

This is an update to an article that I wrote back in 2019. This time around I created a video to go along with the written explanation and documentation below. You can jump straight to the video below if you prefer that medium. What is Calendar Over Run? Consider the […]

Read More »

The Best Way to use Power BI with Microsoft Forms

By Jason Cockington / April 20, 2021 February 4, 2022 / Excel, How to, Power BI Desktop

A client recently asked me if it was possible to build a Power BI report using data from a Microsoft Form. I have come across this question a few times now, and you could be excused for thinking this would be a straightforward task.  Despite the fact that Microsoft has […]

Read More »

Webinar

Supercharge Power BI 3rd Edition Live Webinar

By Matt Allington / April 6, 2021 April 6, 2021 / Learning Resource, Webinar

To celebrate the release of the third edition of my book Supercharge Power BI, I plan to hold a live webinar this coming Thursday pm (US time), Friday morning Australia/NZ time. Sorry, it will be very late for Europe.  I plan to cover 1 topic from my book, and I […]

Read More »

Ebenezer

My Power BI Chat with Ebenezer from Ghana, Africa

By Matt Allington / March 31, 2021 March 31, 2021 / Opinion, Power BI

One interesting trend I have seen over the last 12 months is the creation of a lot more non-technical Power BI content on the web.  Adam Saxton and Patrick LeBlanc were early adopters of this format with their YouTube channel “Guy in a Cube”. More recently there have been new […]

Read More »

Power BI Design and Visualisation Training

Power BI Design and Visualisation Training Course

By Matt Allington / March 25, 2021 March 25, 2021 / Skillwave, Training, Training Videos

As you will most likely know well by now, there is a lot to learn if you want to be good at Power BI. You need to learn skills across the 4 distinct areas as shown below. Ken, Miguel and I are really excited that we have released a new […]

Read More »

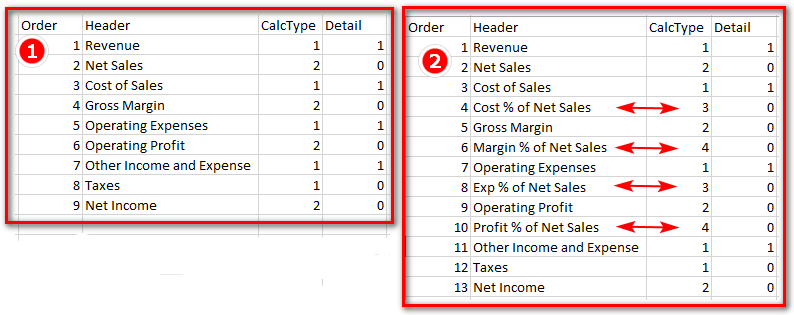
Building a P&L in Power BI – Part 2 (Percentages)

By Matt Allington / March 23, 2021 May 28, 2021 / DAX, How to, Intermediate, Learning Resource, Power BI, Training Videos

I blogged about how to Build a P&L With Power BI back in April 2020, and the response from my readers was great. Several people asked how to add percentages such as % of net sales revenue, % gross profit, etc. into the P&L. I decided therefore to do a […]

Read More »

Supercharge

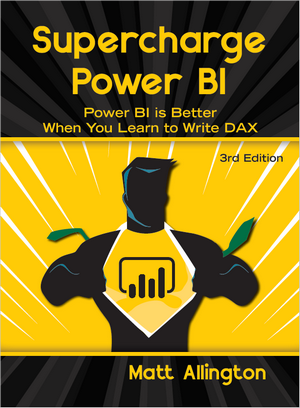
Supercharge Power BI 3rd Edition

By Matt Allington / March 17, 2021 May 1, 2022 / DAX, Learn to Write DAX

I am proud and excited to announce that I have again updated my best-selling DAX book Supercharge Power BI, now in its 3rd edition. This book as a long history: First released back in Sept 2015 under the title “Learn to Write DAX”. Updated in June 2018 (2nd editions) in […]

Read More »

Skillwave.Training is bigger and better than ever

By Matt Allington / March 10, 2021 March 10, 2021 / Learning Resource

Well I am pretty excited to let you know that we (Ken Puls, Miguel Escobar and I) have launched our brand new website for Skillwave.Training. We are dedicated to providing you with the best possible learning experience and have completely revamped the look and feel of our website. We also […]

Read More »

Install Pbi 1

The Best Way to Install Power BI Desktop

By Matt Allington / March 2, 2021 March 11, 2021 / Beginners, How to, Learning Resource, Power BI Desktop

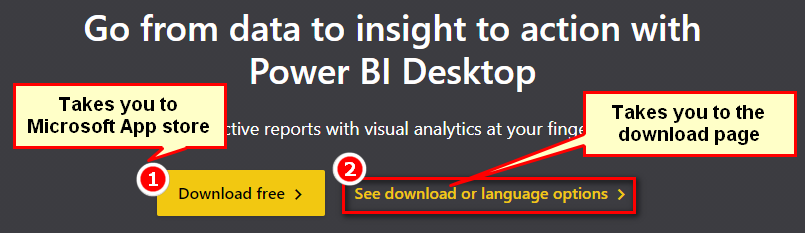
Power BI Desktop is a free, standalone self service BI tool for data modelling and reporting.  You will not get a better, free desktop data modelling and reporting tool than this anywhere.   Power BI Desktop is evolving at a rapid rate with updates released every month. Due to the […]

Read More »

What Is Power Bi Featured Image

What is Power BI and Why Should I Care?

By Matt Allington / February 20, 2021 February 23, 2021 / Beginners, Power BI, Power BI Desktop, Power BI User Group, Power Query, PUG, Visuals

As my regular readers may know, I am the co-organiser and co-founder for the official Power BI User Group here in Sydney.  During the period where COVID has impacted our ability to congregate face to face, Iman and I have been running virtual, online meetup events.  Last week I presented […]

Read More »

Weekly Calendar Table

Power BI Calendar Tables

By Matt Allington / February 2, 2021 April 19, 2024 / Beginners, How to, Learning Resource, Power Query, PowerPivot

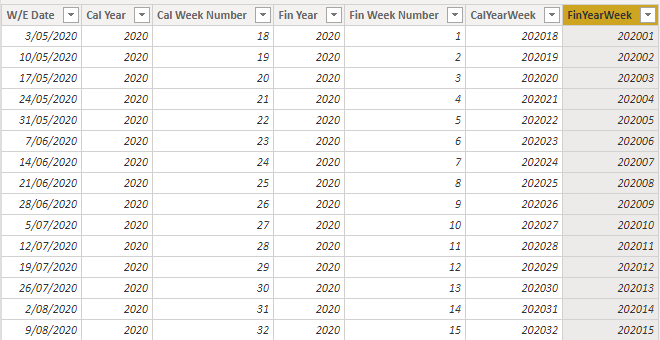
Level: Beginners  First posted May 2015, Updated Feb 2021.  Many aspects of this article also apply to Power Pivot for Excel. Technically you don’t need calendar tables to use Power BI.  Power BI comes with an inbuilt date capability called “Auto Time Intelligence”.  But the inbuilt capability is very basic, […]

Read More »

Debug Dax Featured Image

Debugging DAX with Tooltips

By Matt Allington / January 22, 2021 January 27, 2021 / DAX, How to, Intermediate, Learning Resource, Power BI, Power BI Desktop

Level: Intermediate DAX is a tricky language; on the surface it is deceptively simple, but under the hood it can quickly become complex and it can take many years to master. If you have ever typed a formula and crossed your fingers when you press Enter, then you know what […]

Read More »

Shaping Modelling

Shaping vs Modelling in Power BI

By Matt Allington / January 20, 2021 January 21, 2021 / Beginners, How to, Learning Resource, Power BI, Power BI Desktop, Power Query, PowerPivot

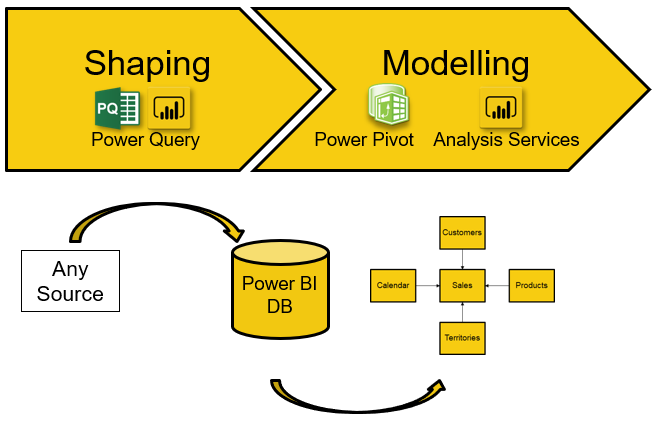
Level: Beginners The objective of this article is to help you understand the differences between shaping your data (using Power Query) and modelling your data (using the modelling tools inside Power BI).  You will need to do both to build a robust Power BI report.  I first wrote this article […]

Read More »

The Most Important Update to Power BI Desktop, Ever!

By Matt Allington / December 17, 2020 December 17, 2020 / Power BI, Power BI Desktop

The December 2020 version of Power BI desktop has just been released, and it is undoubtably the most important release since the first version way back in 2015. The super feature that has been released is an update to composite models using direct query of online datasets. The implications of […]

Read More »

Posts pagination
← Previous Page 1 … 3 4 5 … 19 Next Page →
Agile Insights Excelerator Bi Logo Black 350 X 77 July 2024

Contact details

  • +61 1300 902 217 (AU)

Socials

Facebook Twitter Linkedin Youtube
  • Training
  • Consulting
  • Shop
  • Blogs
  • Training
  • Consulting
  • Shop
  • Blogs

Excelerator BI | © 2025 | Sitemap

adroll_adv_id = "SL2RPW5XMVH4XEWMDBMJGV"; adroll_pix_id = "IGOZLB3K75HKRLOQVTGTEU"; adroll_version = "2.0"; adroll_current_page = "other"; adroll_currency = "AUD"; adroll_language = "en_AU";